Differential expression analysis of broad cell type clusters
Belinda Phipson
10/25/2019
Last updated: 2022-04-07
Checks: 7 0
Knit directory:
Fetal-Gene-Program-snRNAseq/
This reproducible R Markdown analysis was created with workflowr (version 1.7.0). The Checks tab describes the reproducibility checks that were applied when the results were created. The Past versions tab lists the development history.
Great! Since the R Markdown file has been committed to the Git repository, you know the exact version of the code that produced these results.
Great job! The global environment was empty. Objects defined in the global environment can affect the analysis in your R Markdown file in unknown ways. For reproduciblity it’s best to always run the code in an empty environment.
The command set.seed(20220406) was run prior to running
the code in the R Markdown file. Setting a seed ensures that any results
that rely on randomness, e.g. subsampling or permutations, are
reproducible.
Great job! Recording the operating system, R version, and package versions is critical for reproducibility.
Nice! There were no cached chunks for this analysis, so you can be confident that you successfully produced the results during this run.
Great job! Using relative paths to the files within your workflowr project makes it easier to run your code on other machines.
Great! You are using Git for version control. Tracking code development and connecting the code version to the results is critical for reproducibility.
The results in this page were generated with repository version 78db7d6. See the Past versions tab to see a history of the changes made to the R Markdown and HTML files.
Note that you need to be careful to ensure that all relevant files for
the analysis have been committed to Git prior to generating the results
(you can use wflow_publish or
wflow_git_commit). workflowr only checks the R Markdown
file, but you know if there are other scripts or data files that it
depends on. Below is the status of the Git repository when the results
were generated:
working directory clean
Note that any generated files, e.g. HTML, png, CSS, etc., are not included in this status report because it is ok for generated content to have uncommitted changes.
These are the previous versions of the repository in which changes were
made to the R Markdown (analysis/04-DE-BroadCellTypes.Rmd)
and HTML (docs/04-DE-BroadCellTypes.html) files. If you’ve
configured a remote Git repository (see ?wflow_git_remote),
click on the hyperlinks in the table below to view the files as they
were in that past version.
| File | Version | Author | Date | Message |
|---|---|---|---|---|
| Rmd | 78db7d6 | neda-mehdiabadi | 2022-04-07 | wflow_publish(c("analysis/Rmd", "data/txt", "data/README.md", |
Introduction
Load libraries and functions
library(edgeR)Loading required package: limmalibrary(RColorBrewer)
library(org.Hs.eg.db)Loading required package: AnnotationDbiLoading required package: stats4Loading required package: BiocGenerics
Attaching package: 'BiocGenerics'The following object is masked from 'package:limma':
plotMAThe following objects are masked from 'package:stats':
IQR, mad, sd, var, xtabsThe following objects are masked from 'package:base':
anyDuplicated, append, as.data.frame, basename, cbind, colnames,
dirname, do.call, duplicated, eval, evalq, Filter, Find, get, grep,
grepl, intersect, is.unsorted, lapply, Map, mapply, match, mget,
order, paste, pmax, pmax.int, pmin, pmin.int, Position, rank,
rbind, Reduce, rownames, sapply, setdiff, sort, table, tapply,
union, unique, unsplit, which.max, which.minLoading required package: BiobaseWelcome to Bioconductor
Vignettes contain introductory material; view with
'browseVignettes()'. To cite Bioconductor, see
'citation("Biobase")', and for packages 'citation("pkgname")'.Loading required package: IRangesLoading required package: S4Vectors
Attaching package: 'S4Vectors'The following objects are masked from 'package:base':
expand.grid, I, unnamelibrary(limma)
library(Seurat)Attaching SeuratObjectlibrary(cowplot)
library(DelayedArray)Loading required package: Matrix
Attaching package: 'Matrix'The following object is masked from 'package:S4Vectors':
expandLoading required package: MatrixGenericsLoading required package: matrixStats
Attaching package: 'matrixStats'The following objects are masked from 'package:Biobase':
anyMissing, rowMedians
Attaching package: 'MatrixGenerics'The following objects are masked from 'package:matrixStats':
colAlls, colAnyNAs, colAnys, colAvgsPerRowSet, colCollapse,
colCounts, colCummaxs, colCummins, colCumprods, colCumsums,
colDiffs, colIQRDiffs, colIQRs, colLogSumExps, colMadDiffs,
colMads, colMaxs, colMeans2, colMedians, colMins, colOrderStats,
colProds, colQuantiles, colRanges, colRanks, colSdDiffs, colSds,
colSums2, colTabulates, colVarDiffs, colVars, colWeightedMads,
colWeightedMeans, colWeightedMedians, colWeightedSds,
colWeightedVars, rowAlls, rowAnyNAs, rowAnys, rowAvgsPerColSet,
rowCollapse, rowCounts, rowCummaxs, rowCummins, rowCumprods,
rowCumsums, rowDiffs, rowIQRDiffs, rowIQRs, rowLogSumExps,
rowMadDiffs, rowMads, rowMaxs, rowMeans2, rowMedians, rowMins,
rowOrderStats, rowProds, rowQuantiles, rowRanges, rowRanks,
rowSdDiffs, rowSds, rowSums2, rowTabulates, rowVarDiffs, rowVars,
rowWeightedMads, rowWeightedMeans, rowWeightedMedians,
rowWeightedSds, rowWeightedVarsThe following object is masked from 'package:Biobase':
rowMedians
Attaching package: 'DelayedArray'The following objects are masked from 'package:base':
aperm, apply, rowsum, scale, sweeplibrary(scran)Loading required package: SingleCellExperimentLoading required package: SummarizedExperimentLoading required package: GenomicRangesLoading required package: GenomeInfoDb
Attaching package: 'SummarizedExperiment'The following object is masked from 'package:SeuratObject':
AssaysThe following object is masked from 'package:Seurat':
Assays
Attaching package: 'SingleCellExperiment'The following object is masked from 'package:edgeR':
cpmLoading required package: scuttlelibrary(NMF)Loading required package: pkgmakerLoading required package: registry
Attaching package: 'pkgmaker'The following object is masked from 'package:S4Vectors':
new2Loading required package: rngtoolsLoading required package: clusterNMF - BioConductor layer [OK] | Shared memory capabilities [NO: synchronicity] | Cores 31/32 To enable shared memory capabilities, try: install.extras('
NMF
')
Attaching package: 'NMF'The following object is masked from 'package:DelayedArray':
seedThe following object is masked from 'package:S4Vectors':
nrunlibrary(workflowr)
library(ggplot2)
library(clustree)Loading required package: ggraphlibrary(dplyr)
Attaching package: 'dplyr'The following objects are masked from 'package:GenomicRanges':
intersect, setdiff, unionThe following object is masked from 'package:GenomeInfoDb':
intersectThe following object is masked from 'package:matrixStats':
countThe following object is masked from 'package:AnnotationDbi':
selectThe following objects are masked from 'package:IRanges':
collapse, desc, intersect, setdiff, slice, unionThe following objects are masked from 'package:S4Vectors':
first, intersect, rename, setdiff, setequal, unionThe following object is masked from 'package:Biobase':
combineThe following objects are masked from 'package:BiocGenerics':
combine, intersect, setdiff, unionThe following objects are masked from 'package:stats':
filter, lagThe following objects are masked from 'package:base':
intersect, setdiff, setequal, unionsource("code/normCounts.R")
source("code/findModes.R")
source("code/ggplotColors.R")Load the data
targets <- read.delim("data/targets.txt",header=TRUE, stringsAsFactors = FALSE)
targets$FileName2 <- paste(targets$FileName,"/",sep="")
targets$Group_ID2 <- gsub("LV_","",targets$Group_ID)
group <- c("fetal_1","fetal_2","fetal_3",
           "non-diseased_1","non-diseased_2","non-diseased_3",
           "diseased_1","diseased_2",
           "diseased_3","diseased_4")
m <- match(group, targets$Group_ID2)
targets <- targets[m,]
fetal.integrated <- readRDS(file="/group/card2/Neda/MCRI_LAB/single_cell_nuclei_rnaseq/Porello-heart-snRNAseq/output/RDataObjects/fetal-int.Rds")
load(file="/group/card2/Neda/MCRI_LAB/single_cell_nuclei_rnaseq/Porello-heart-snRNAseq/output/RDataObjects/fetalObjs.Rdata")
##note: nd.integrated is also an integrated form of young heart samples. young.integrated has already been published in Sim et al., 2021
nd.integrated <- readRDS(file="/group/card2/Neda/MCRI_LAB/single_cell_nuclei_rnaseq/Porello-heart-snRNAseq/output/RDataObjects/nd-int.Rds")
load(file="/group/card2/Neda/MCRI_LAB/single_cell_nuclei_rnaseq/Porello-heart-snRNAseq/output/RDataObjects/ndObjs.Rdata")
dcm.integrated <- readRDS(file="/group/card2/Neda/MCRI_LAB/single_cell_nuclei_rnaseq/Porello-heart-snRNAseq/output/RDataObjects/dcm-int.Rds")
load(file="/group/card2/Neda/MCRI_LAB/single_cell_nuclei_rnaseq/Porello-heart-snRNAseq/output/RDataObjects/dcmObjs.Rdata")# Load unfiltered counts matrix for every sample (object all)
load("/group/card2/Neda/MCRI_LAB/single_cell_nuclei_rnaseq/Porello-heart-snRNAseq/output/RDataObjects/all-counts.Rdata")Set default clustering resolution
# Default 0.3
Idents(fetal.integrated) <- fetal.integrated$integrated_snn_res.0.3
DimPlot(fetal.integrated, reduction = "tsne",label=TRUE,label.size = 6)+NoLegend()

# Default 0.3
Idents(nd.integrated) <- nd.integrated$integrated_snn_res.0.3
DimPlot(nd.integrated, reduction = "tsne",label=TRUE,label.size = 6)+NoLegend()

# Default 0.3
Idents(dcm.integrated) <- dcm.integrated$integrated_snn_res.0.3
DimPlot(dcm.integrated, reduction = "tsne",label=TRUE,label.size = 6)+NoLegend()
Merge all data together
# This data has already been generated and saved as the heart object.
heart <- merge(fetal.integrated, y = c(nd.integrated, dcm.integrated), project = "heart")
heart <- readRDS("/group/card2/Neda/MCRI_LAB/must-do-projects/EnzoPorrelloLab/dilated-cardiomyopathy/data/heart-int-FND-filtered.Rds")
Idents(heart) <- heart$Broad_celltype
table(heart$orig.ident)
Fetal    ND   DCM
27760 16964 32712
Remove Er and CM(Prlf) cells
heart <- subset(heart,subset = Broad_celltype != "Er")
heart <- subset(heart,subset = Broad_celltype != "CM(Prlf)")
heart$biorep <- factor(heart$biorep,levels=c("f1","f2","f3","nd1","nd2","nd3","d1","d2","d3","d4"))
table(heart$Broad_celltype,heart$biorep)
             f1   f2   f3  nd1  nd2  nd3   d1   d2   d3   d4
  Er          0    0    0    0    0    0    0    0    0    0
  CM(Prlf)    0    0    0    0    0    0    0    0    0    0
  CM       4639 7146 4548 1073 2221 4456 2925 2025 4093 1247
  Endo      735  715 1298  511  462  550  880 3099  850  781
  Pericyte  564  425  404  613  280  260  822 1075  506  468
  Fib      1029  755 1201 1622 1688  805 3151 2404 1598 1832
  Immune    287  274  196  337  808  731  442 1501  815 1053
  Neuron    109  130  110  207   71  133  189  120   95   47
  Smc        54   20  136   59   28   49  296  173  162   63
Get gene annotation
columns(org.Hs.eg.db) [1] "ACCNUM" "ALIAS" "ENSEMBL" "ENSEMBLPROT" "ENSEMBLTRANS"
[6] "ENTREZID" "ENZYME" "EVIDENCE" "EVIDENCEALL" "GENENAME"
[11] "GENETYPE" "GO" "GOALL" "IPI" "MAP"
[16] "OMIM" "ONTOLOGY" "ONTOLOGYALL" "PATH" "PFAM"
[21] "PMID" "PROSITE" "REFSEQ" "SYMBOL" "UCSCKG"
[26] "UNIPROT" DefaultAssay(heart) <- "RNA"
ann <- AnnotationDbi:::select(org.Hs.eg.db,keys=rownames(all),columns=c("SYMBOL","ENTREZID","ENSEMBL","GENENAME","CHR"),keytype = "SYMBOL")Warning in .deprecatedColsMessage(): Accessing gene location information via 'CHR','CHRLOC','CHRLOCEND' is
deprecated. Please use a range based accessor like genes(), or select()
with columns values like TXCHROM and TXSTART on a TxDb or OrganismDb
object instead.'select()' returned 1:many mapping between keys and columnsm <- match(rownames(all),ann$SYMBOL)
ann <- ann[m,]
table(ann$SYMBOL==rownames(all))
 TRUE
33939
mito <- grep("mitochondrial",ann$GENENAME)
length(mito)[1] 224ribo <- grep("ribosomal",ann$GENENAME)
length(ribo)[1] 197missingEZID <- which(is.na(ann$ENTREZID))
length(missingEZID)[1] 10976Filter out non-informative genes
m <- match(colnames(heart),colnames(all))
all.counts <- all[,m]
chuck <- unique(c(mito,ribo,missingEZID))
length(chuck)[1] 11318all.counts.keep <- all.counts[-chuck,]
ann.keep <- ann[-chuck,]
table(ann.keep$SYMBOL==rownames(all.counts.keep))
 TRUE
22621
# remove x y genes
xy <- ann.keep$CHR %in% c("X","Y")
all.counts.keep <- all.counts.keep[!xy,]
ann.keep <- ann.keep[!xy,]numzero.genes <- rowSums(all.counts.keep==0)
table(numzero.genes > (ncol(all.counts.keep)-20))
FALSE  TRUE
18177  3456
keep.genes <- numzero.genes < (ncol(all.counts.keep)-20)
table(keep.genes)keep.genes
FALSE TRUE
3492 18141 all.keep <- all.counts.keep[keep.genes,]
dim(all.keep)[1] 18141 74451ann.keep <- ann.keep[keep.genes,]
table(colnames(heart)==colnames(all.keep))
 TRUE
74451
table(rownames(all.keep)==ann.keep$SYMBOL)
 TRUE
18141
Create pseudobulk samples
broadct <- factor(heart$Broad_celltype)
sam <- factor(heart$biorep,levels=c("f1","f2","f3","nd1","nd2","nd3","d1","d2","d3","d4"))
newgrp <- paste(broadct,sam,sep=".")
newgrp <- factor(newgrp,levels=paste(rep(levels(broadct),each=10),levels(sam),sep="."))
table(newgrp)
newgrp
CM.f1 CM.f2 CM.f3 CM.nd1 CM.nd2 CM.nd3
4639 7146 4548 1073 2221 4456
CM.d1 CM.d2 CM.d3 CM.d4 Endo.f1 Endo.f2
2925 2025 4093 1247 735 715
Endo.f3 Endo.nd1 Endo.nd2 Endo.nd3 Endo.d1 Endo.d2
1298 511 462 550 880 3099
Endo.d3 Endo.d4 Pericyte.f1 Pericyte.f2 Pericyte.f3 Pericyte.nd1
850 781 564 425 404 613
Pericyte.nd2 Pericyte.nd3 Pericyte.d1 Pericyte.d2 Pericyte.d3 Pericyte.d4
280 260 822 1075 506 468
Fib.f1 Fib.f2 Fib.f3 Fib.nd1 Fib.nd2 Fib.nd3
1029 755 1201 1622 1688 805
Fib.d1 Fib.d2 Fib.d3 Fib.d4 Immune.f1 Immune.f2
3151 2404 1598 1832 287 274
Immune.f3 Immune.nd1 Immune.nd2 Immune.nd3 Immune.d1 Immune.d2
196 337 808 731 442 1501
Immune.d3 Immune.d4 Neuron.f1 Neuron.f2 Neuron.f3 Neuron.nd1
815 1053 109 130 110 207
Neuron.nd2 Neuron.nd3 Neuron.d1 Neuron.d2 Neuron.d3 Neuron.d4
71 133 189 120 95 47
Smc.f1 Smc.f2 Smc.f3 Smc.nd1 Smc.nd2 Smc.nd3
54 20 136 59 28 49
Smc.d1 Smc.d2 Smc.d3 Smc.d4
296 173 162 63 des <- model.matrix(~0+newgrp)
colnames(des) <- levels(newgrp)
dim(des)[1] 74451 70pb <- all.keep %*% desy.pb <- DGEList(pb)
saminfo <- matrix(unlist(strsplit(colnames(y.pb$counts),split="[.]")),ncol=2,byrow=TRUE)
bct <- factor(saminfo[,1])
indiv <- factor(saminfo[,2])
group <- rep(NA,ncol(y.pb))
group[grep("f",indiv)] <- "Fetal"
group[grep("nd",indiv)] <- "ND"
group[grep("^d",indiv)] <- "DCM"
group <- factor(group,levels=c("Fetal","ND","DCM"))
targets.pb <- data.frame(bct,indiv,group)
targets.pb$Sex <- c("Male","Male","Female","Male","Female","Male","Male","Female","Female","Female")par(mfrow=c(1,1))
sexgroup <- paste(group,targets.pb$Sex,sep=".")
plotMDS.DGEList(y.pb,gene.selection="common",col=ggplotColors(7)[bct],pch=c(0,15,1,16,2,17)[factor(sexgroup)],cex=2)
legend("bottomright",legend=levels(bct),fill=ggplotColors(7),bty="n")
legend("bottomleft",legend=c("Female","Male"),pch=c(1,16),cex=1.5)
legend("topright",legend=c("Fetal","ND","DCM"),pch=c(1,2,0),cex=1.5)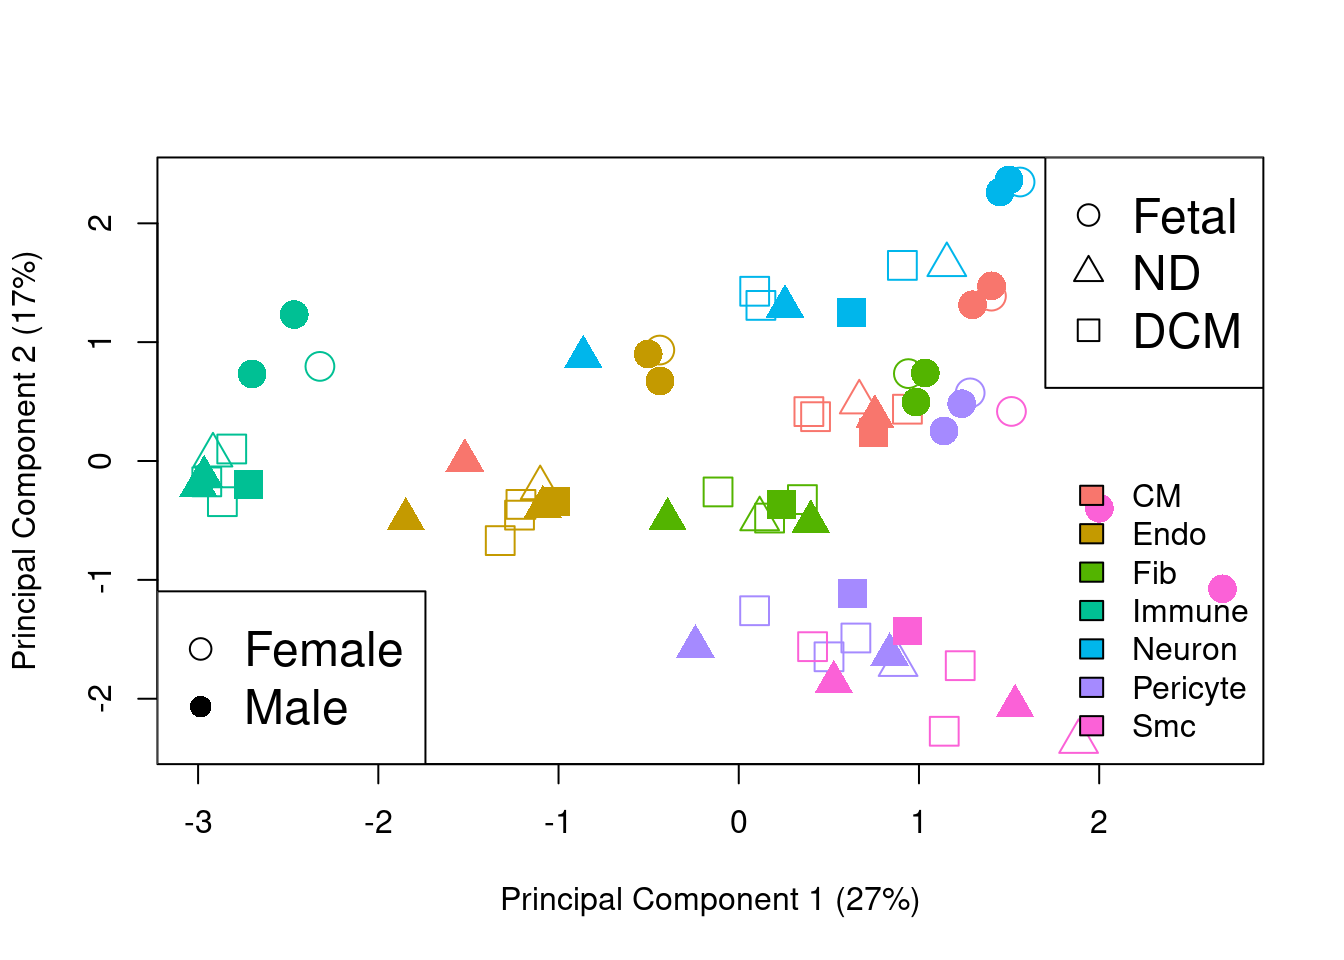
plotMDS.DGEList(y.pb,gene.selection="common",col=ggplotColors(7)[bct],pch=c(0,15,1,16,2,17)[factor(sexgroup)],cex=2,dim=c(3,4))
legend("bottomright",legend=levels(bct),fill=ggplotColors(7),bty="n")
legend("top",legend=c("Female","Male"),pch=c(1,16),cex=1.5)
legend("topright",legend=c("Fetal","ND","DCM"),pch=c(1,2,0),cex=1.5)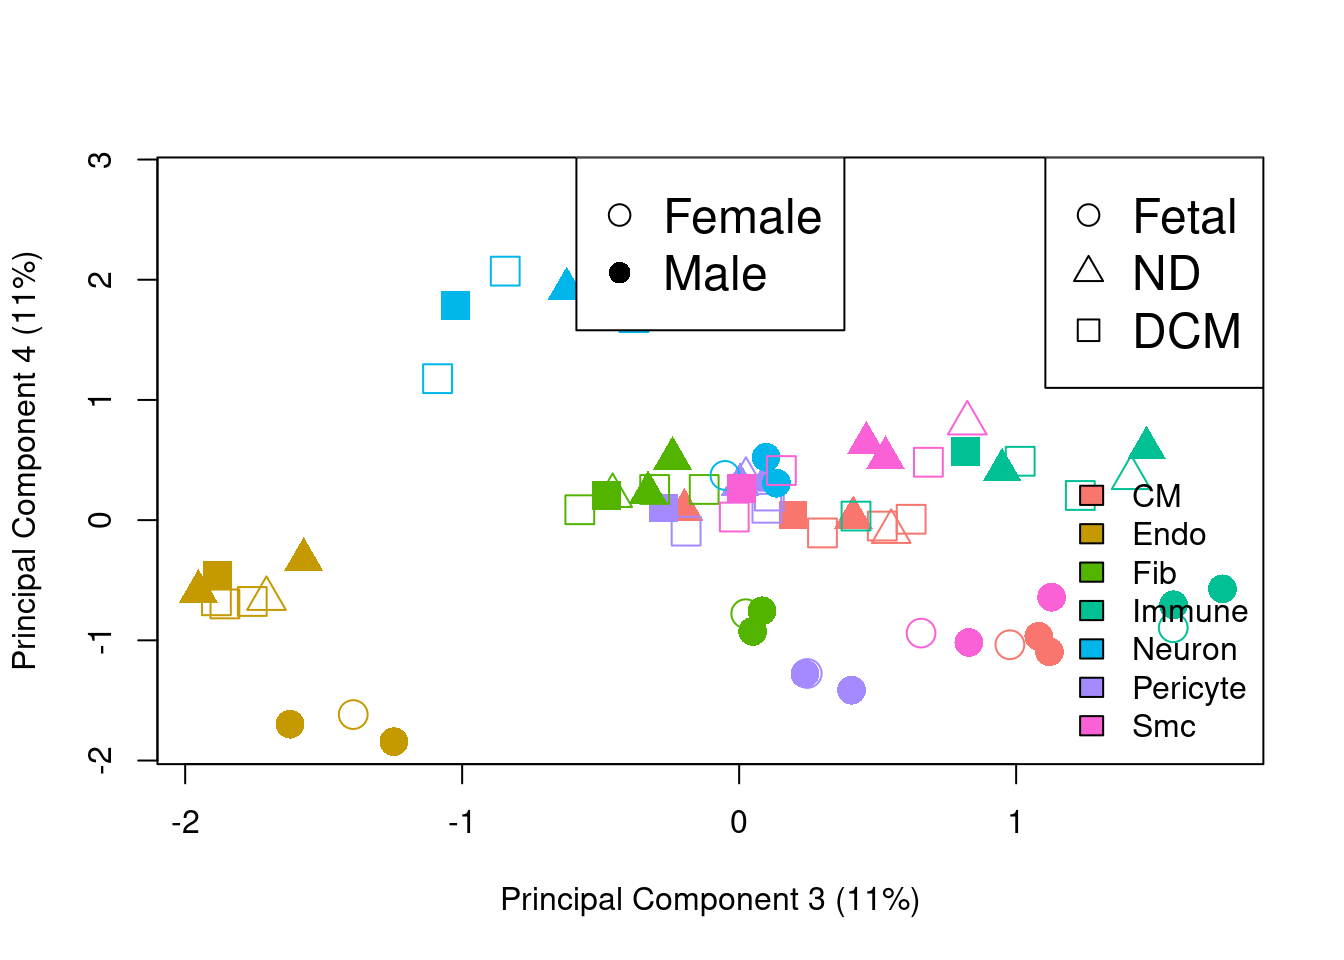
plotMDS.DGEList(y.pb,gene.selection="common",col=ggplotColors(7)[bct],pch=c(0,15,1,16,2,17)[factor(sexgroup)],cex=2,dim=c(5,6))
legend("bottomleft",legend=levels(bct),fill=ggplotColors(7),bty="n")
legend("top",legend=c("Female","Male"),pch=c(1,16),cex=1.5)
legend("bottomright",legend=c("Fetal","ND","DCM"),pch=c(1,2,0),cex=1.5)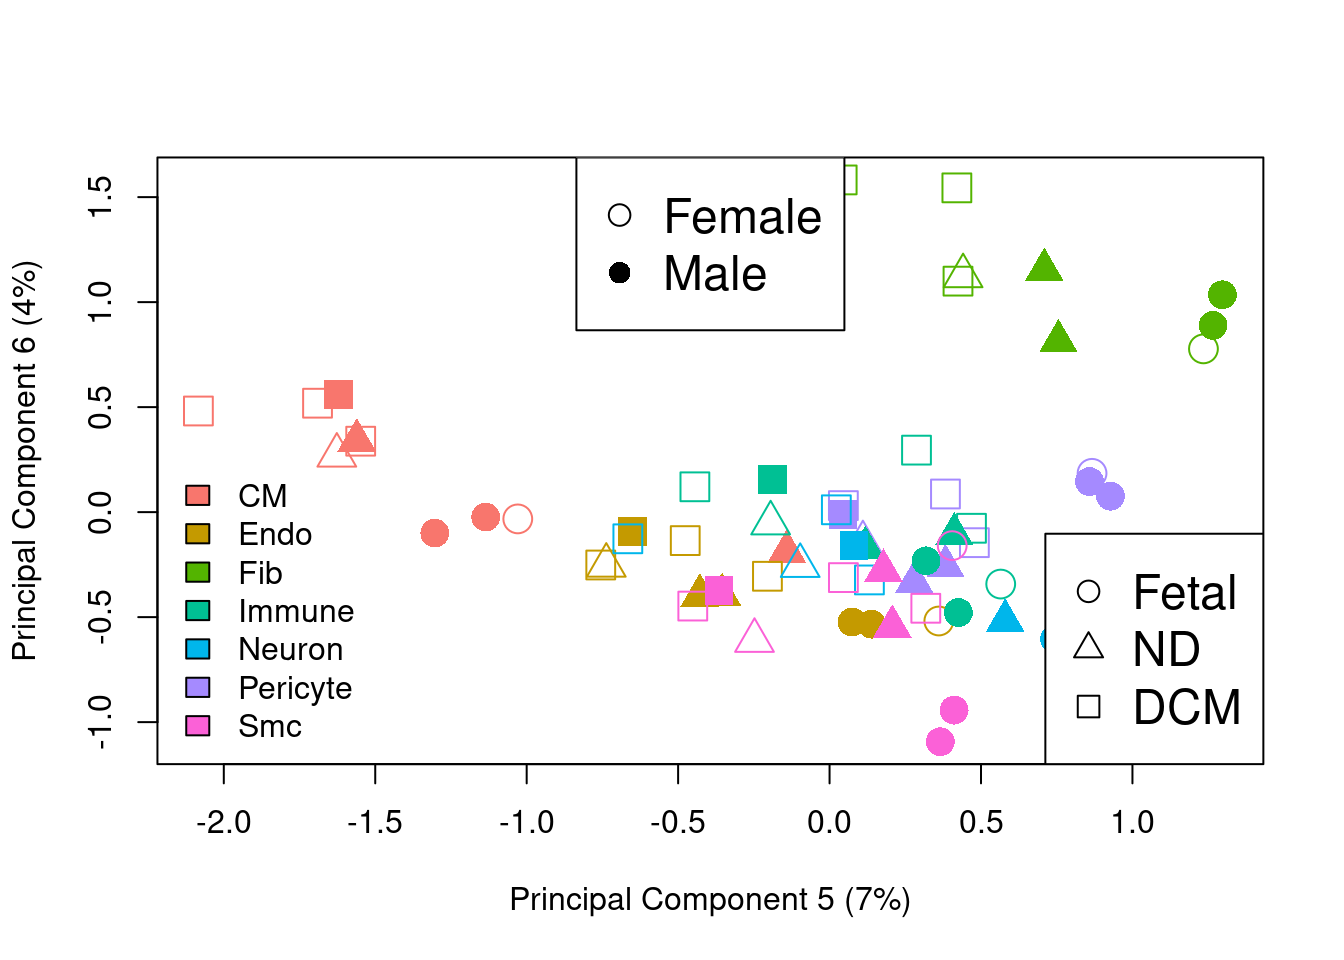
Differential expression analysis
table(rownames(y.pb)==ann.keep$SYMBOL)
 TRUE
18141
y.pb$genes <- ann.keep
bct2 <- as.character(bct)
bct2[bct2 == "CM"] <- "cardio"
bct2[bct2 == "Endo"] <- "endo"
bct2[bct2 == "Pericyte"] <- "peri"
bct2[bct2 == "Fib"] <- "fibro"
bct2[bct2 == "Immune"] <- "immune"
bct2[bct2 == "Neuron"] <- "neurons"
bct2[bct2 == "Smc"] <- "smc"
newgrp <- paste(bct2,group,targets.pb$Sex,sep=".")
newgrp <- factor(newgrp)
design <- model.matrix(~0+newgrp)
colnames(design) <- levels(newgrp)
v <- voom(y.pb,design,plot=TRUE,normalize.method = "cyclicloess")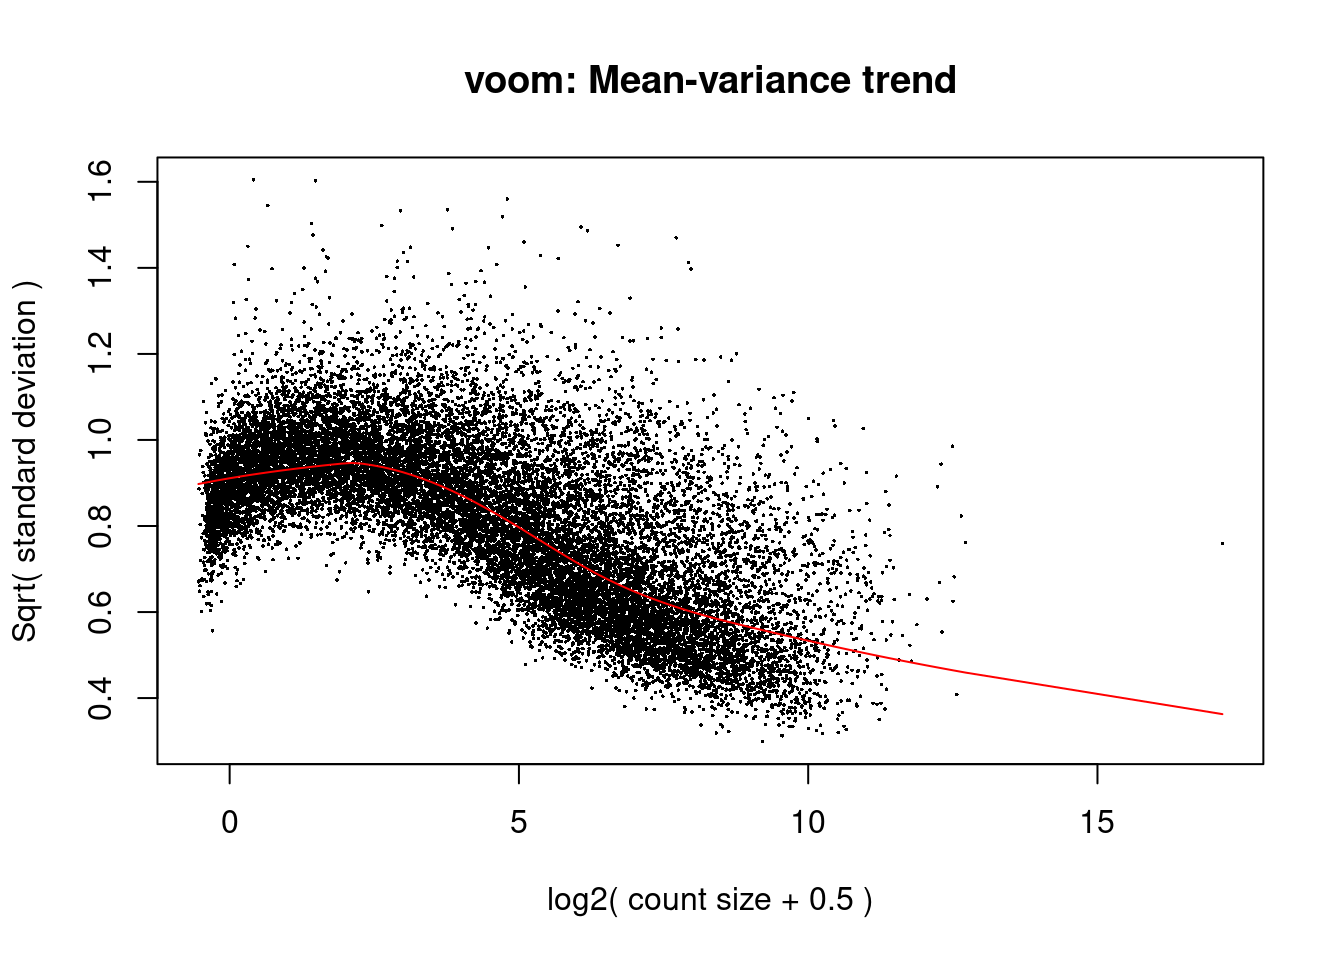
fit <- lmFit(v,design)Cardiomyocytes
cont.cardio <- makeContrasts(NvF = 0.5*(cardio.ND.Male + cardio.ND.Female) - 0.5*(cardio.Fetal.Male + cardio.Fetal.Female),
                         DvF = 0.5*(cardio.DCM.Male + cardio.DCM.Female) - 0.5*(cardio.Fetal.Male + cardio.Fetal.Female),
                         DvN = 0.5*(cardio.DCM.Male + cardio.DCM.Female) - 0.5*(cardio.ND.Male + cardio.ND.Female),
                         SexFetal = cardio.Fetal.Male - cardio.Fetal.Female,
                         SexND = cardio.ND.Male - cardio.ND.Female,
                         SexDCM = cardio.DCM.Male - cardio.DCM.Female,
                         InteractionDF = (cardio.DCM.Male - cardio.Fetal.Male) - (cardio.DCM.Female - cardio.Fetal.Female),
                         InteractionNF = (cardio.ND.Male - cardio.Fetal.Male) - (cardio.ND.Female - cardio.Fetal.Female),
                         InteractionDN = (cardio.DCM.Male - cardio.ND.Male) - (cardio.DCM.Female - cardio.ND.Female),
                         levels=design)
fit.cardio <- contrasts.fit(fit,contrasts = cont.cardio)
fit.cardio <- eBayes(fit.cardio,robust=TRUE)

summary(decideTests(fit.cardio))
NvF DvF DvN SexFetal SexND SexDCM InteractionDF InteractionNF
Down 2458 3490 1239 129 134 1617 807 25
NotSig 13023 10503 15068 17989 17979 14439 16103 18084
Up 2660 4148 1834 23 28 2085 1231 32
InteractionDN
Down 370
NotSig 16903
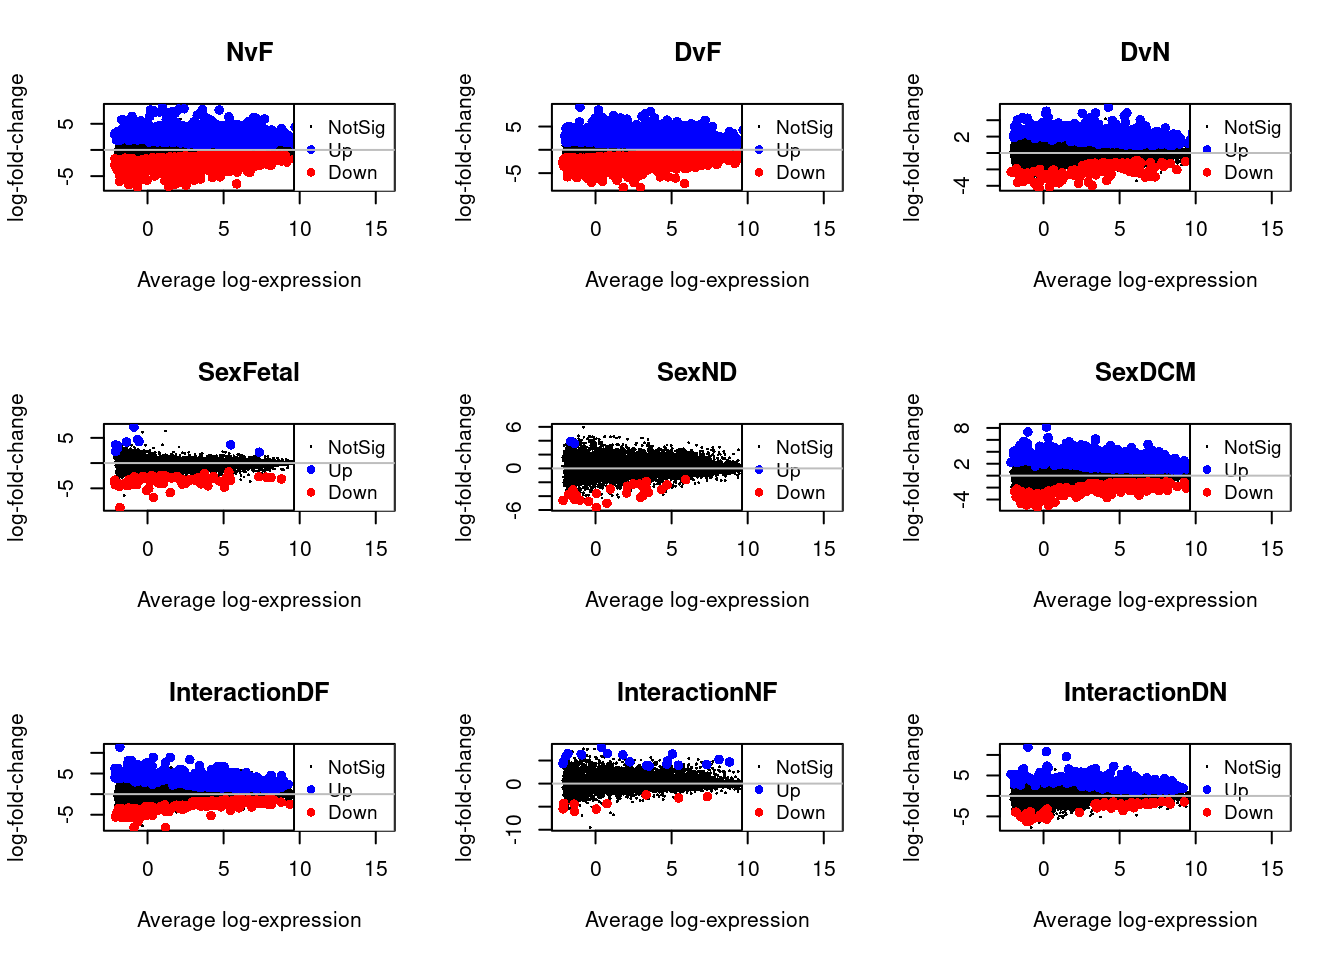
Up 868treat.cardio <- treat(fit.cardio,lfc=0.5)
dt.cardio<-decideTests(treat.cardio)
summary(dt.cardio) NvF DvF DvN SexFetal SexND SexDCM InteractionDF InteractionNF
Down 996 1522 153 72 27 340 183 10
NotSig 16059 14599 17507 18059 18112 16940 17453 18112
Up 1086 2020 481 10 2 861 505 19
InteractionDN
Down 55
NotSig 17727
Up 359par(mfrow=c(3,3))
for(i in 1:9){
plotMD(treat.cardio,coef=i,status=dt.cardio[,i],hl.col=c("blue","red"))
abline(h=0,col="grey")
}
par(mfrow=c(1,1))
par(mar=c(7,4,2,2))
barplot(summary(dt.cardio)[-2,],beside=TRUE,legend=TRUE,col=c("blue","red"),ylab="Number of significant genes",las=2,xlab="")
title("Cardiomyocytes")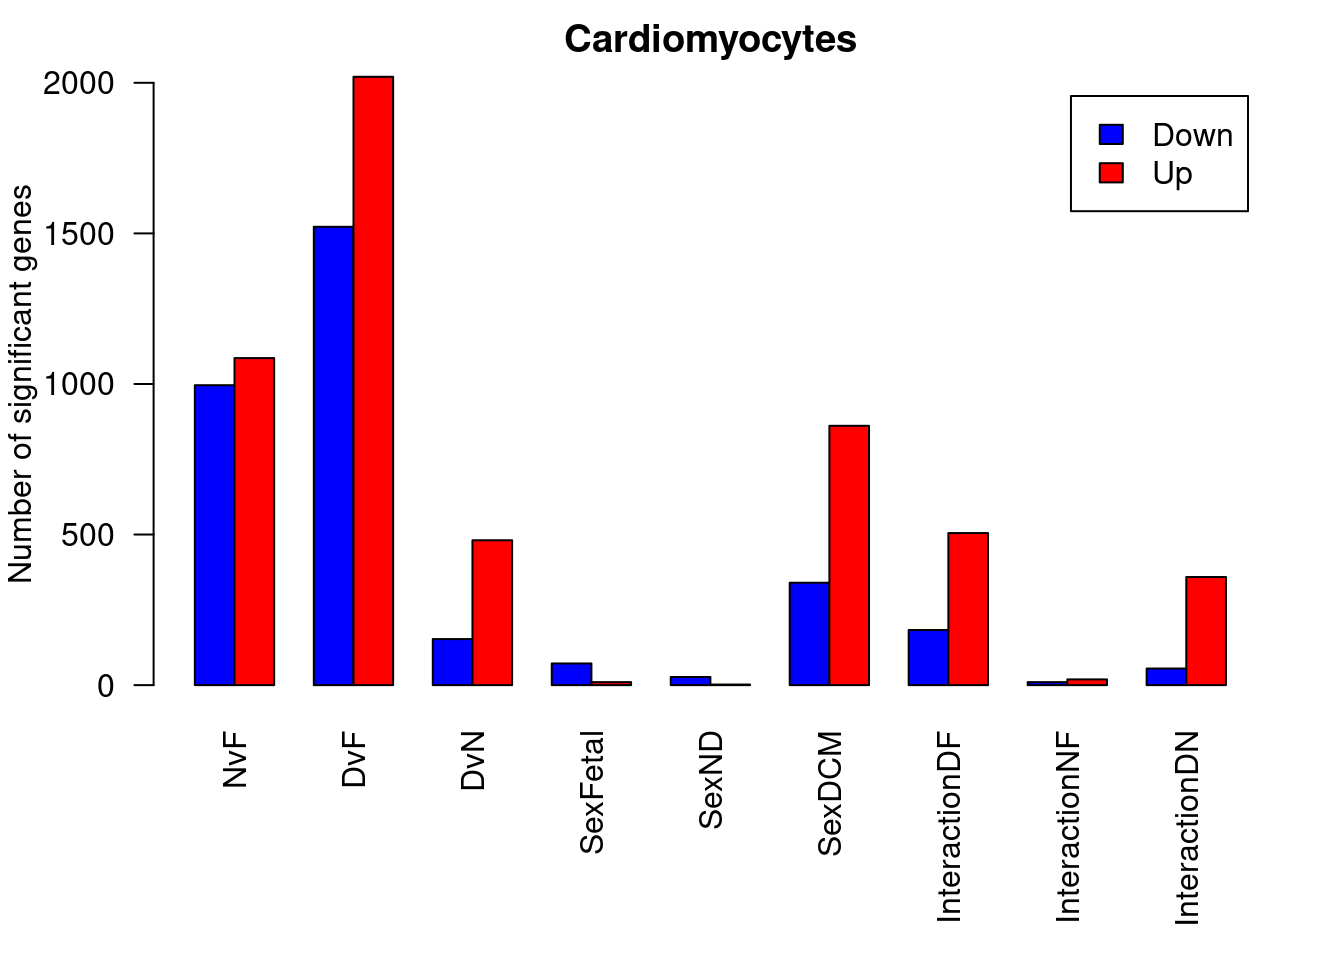
ND vs Fetal
options(digits=3)
topTreat(treat.cardio,coef=1,n=20,p.value=0.05)[,-c(1:3)]
GENENAME CHR logFC
IGF2BP3 insulin like growth factor 2 mRNA binding protein 3 7 -5.29
LINC01621 long intergenic non-protein coding RNA 1621 6 -6.00
FRMD5 FERM domain containing 5 15 -4.24
MIR29B2CHG MIR29B2 and MIR29C host gene 1 4.03
IGF2BP1 insulin like growth factor 2 mRNA binding protein 1 17 -6.66
CNOT11 CCR4-NOT transcription complex subunit 11 2 -2.15
CFAP61 cilia and flagella associated protein 61 20 4.94
KCNQ5 potassium voltage-gated channel subfamily Q member 5 6 -6.48
AQP7 aquaporin 7 9 6.10
TOGARAM2 TOG array regulator of axonemal microtubules 2 2 7.86
BMP7 bone morphogenetic protein 7 20 -4.18
PRSS35 serine protease 35 6 -4.97
NCEH1 neutral cholesterol ester hydrolase 1 3 4.08
TMEM178B transmembrane protein 178B 7 7.63
PCAT1 prostate cancer associated transcript 1 8 -3.77
CUX2 cut like homeobox 2 12 -5.76
MBOAT2 membrane bound O-acyltransferase domain containing 2 2 -3.26
LINC02008 long intergenic non-protein coding RNA 2008 3 -4.26
ADAM11 ADAM metallopeptidase domain 11 17 -4.71
THRB thyroid hormone receptor beta 3 5.00
AveExpr t P.Value adj.P.Val
IGF2BP3 4.26 -17.5 2.20e-18 3.99e-14
LINC01621 -1.84 -16.7 8.38e-18 7.61e-14
FRMD5 5.90 -15.1 1.48e-16 7.93e-13
MIR29B2CHG 6.62 15.0 1.75e-16 7.93e-13
IGF2BP1 1.43 -14.4 5.63e-16 2.04e-12
CNOT11 5.21 -14.2 9.33e-16 2.82e-12
CFAP61 3.91 13.8 1.94e-15 4.66e-12
KCNQ5 5.85 -13.8 2.05e-15 4.66e-12
AQP7 3.88 13.6 3.14e-15 6.34e-12
TOGARAM2 2.40 13.1 9.15e-15 1.66e-11
BMP7 2.14 -12.6 2.45e-14 3.76e-11
PRSS35 1.23 -12.6 2.49e-14 3.76e-11
NCEH1 5.56 12.5 3.01e-14 4.20e-11
TMEM178B 4.71 12.2 5.55e-14 7.19e-11
PCAT1 5.39 -12.1 7.05e-14 8.53e-11
CUX2 3.07 -11.9 1.04e-13 1.17e-10
MBOAT2 6.18 -11.9 1.10e-13 1.17e-10
LINC02008 2.90 -11.6 1.96e-13 1.88e-10
ADAM11 1.91 -11.6 1.96e-13 1.88e-10
THRB 6.99 11.6 2.26e-13 2.05e-10DCM vs Fetal
topTreat(treat.cardio,coef=2,n=20,p.value=0.05)[,-c(1:3)] GENENAME CHR logFC
IGF2BP3 insulin like growth factor 2 mRNA binding protein 3 7 -5.80
MIR29B2CHG MIR29B2 and MIR29C host gene 1 4.72
CFAP61 cilia and flagella associated protein 61 20 6.12
LINC01621 long intergenic non-protein coding RNA 1621 6 -5.79
MET MET proto-oncogene, receptor tyrosine kinase 7 5.08
RSBN1 round spermatid basic protein 1 1 2.27
KCNQ5 potassium voltage-gated channel subfamily Q member 5 6 -7.27
FRMD5 FERM domain containing 5 15 -4.03
BMP7 bone morphogenetic protein 7 20 -5.55
UBE2QL1 ubiquitin conjugating enzyme E2 Q family like 1 5 4.21
IGF2BP1 insulin like growth factor 2 mRNA binding protein 1 17 -6.41
FYTTD1 forty-two-three domain containing 1 3 2.56
DIAPH1 diaphanous related formin 1 5 3.83
DENND2C DENN domain containing 2C 1 3.38
SGMS2 sphingomyelin synthase 2 4 4.44
SPTBN4 spectrin beta, non-erythrocytic 4 19 3.44
ASCC2 activating signal cointegrator 1 complex subunit 2 22 2.18
ABHD2 abhydrolase domain containing 2, acylglycerol lipase 15 4.86
PRSS35 serine protease 35 6 -5.26
AQP7 aquaporin 7 9 5.91
AveExpr t P.Value adj.P.Val
IGF2BP3 4.26 -19.3 1.24e-19 2.25e-15
MIR29B2CHG 6.62 18.8 2.51e-19 2.28e-15
CFAP61 3.91 18.4 5.10e-19 3.08e-15
LINC01621 -1.84 -16.8 7.70e-18 3.49e-14
MET 2.88 15.5 7.36e-17 1.84e-13
RSBN1 5.85 15.5 7.39e-17 1.84e-13
KCNQ5 5.85 -15.5 7.96e-17 1.84e-13
FRMD5 5.90 -15.4 9.04e-17 1.84e-13
BMP7 2.14 -15.4 9.13e-17 1.84e-13
UBE2QL1 2.16 15.3 1.07e-16 1.94e-13
IGF2BP1 1.43 -15.2 1.31e-16 2.16e-13
FYTTD1 5.51 14.9 2.14e-16 3.23e-13
DIAPH1 6.60 14.7 3.21e-16 4.48e-13
DENND2C 4.45 14.5 4.97e-16 6.44e-13
SGMS2 4.84 14.4 5.86e-16 7.08e-13
SPTBN4 3.34 14.0 1.42e-15 1.61e-12
ASCC2 5.60 13.8 2.14e-15 2.28e-12
ABHD2 7.11 13.5 3.58e-15 3.61e-12
PRSS35 1.23 -13.4 4.74e-15 4.53e-12
AQP7 3.88 13.1 8.14e-15 7.24e-12DCM vs ND
topTreat(treat.cardio,coef=3,n=20,p.value=0.05)[,-c(1:3)] GENENAME CHR
RSBN1 round spermatid basic protein 1 1
MYH9 myosin heavy chain 9 22
DAPK3 death associated protein kinase 3 19
WEE1 WEE1 G2 checkpoint kinase 11
ABCG2 ATP binding cassette subfamily G member 2 (Junior blood group) 4
MFN2 mitofusin 2 1
UBE2QL1 ubiquitin conjugating enzyme E2 Q family like 1 5
FYTTD1 forty-two-three domain containing 1 3
DNAJA4 DnaJ heat shock protein family (Hsp40) member A4 15
EIF2AK3 eukaryotic translation initiation factor 2 alpha kinase 3 2
ASB2 ankyrin repeat and SOCS box containing 2 14
BMPR1A bone morphogenetic protein receptor type 1A 10
CYP2J2 cytochrome P450 family 2 subfamily J member 2 1
ACTN4 actinin alpha 4 19
ATRNL1 attractin like 1 10
LMTK2 lemur tyrosine kinase 2 7
PER2 period circadian regulator 2 2
RUBCN rubicon autophagy regulator 3
RAB21 RAB21, member RAS oncogene family 12
OXCT1 3-oxoacid CoA-transferase 1 5
logFC AveExpr t P.Value adj.P.Val
RSBN1 2.09 5.85 12.95 1.12e-14 1.69e-10
MYH9 2.64 7.95 12.71 1.86e-14 1.69e-10
DAPK3 2.54 5.58 11.55 2.41e-13 1.31e-09
WEE1 2.99 4.88 11.48 2.88e-13 1.31e-09
ABCG2 3.96 4.52 11.17 5.80e-13 2.10e-09
MFN2 1.96 5.35 10.33 4.24e-12 1.28e-08
UBE2QL1 2.90 2.16 10.09 7.63e-12 1.98e-08
FYTTD1 1.87 5.51 9.63 2.40e-11 5.44e-08
DNAJA4 2.96 3.63 9.55 2.97e-11 5.98e-08
EIF2AK3 3.09 6.74 9.34 5.06e-11 9.17e-08
ASB2 3.88 3.36 9.14 8.61e-11 1.35e-07
BMPR1A 1.83 8.04 9.12 8.90e-11 1.35e-07
CYP2J2 3.51 3.62 9.03 1.14e-10 1.60e-07
ACTN4 2.04 7.78 8.83 1.91e-10 2.47e-07
ATRNL1 5.60 4.26 8.81 2.05e-10 2.48e-07
LMTK2 1.45 6.17 8.55 4.04e-10 4.59e-07
PER2 3.07 4.94 8.48 4.88e-10 5.20e-07
RUBCN 1.80 5.87 8.41 5.77e-10 5.81e-07
RAB21 1.68 6.53 8.37 6.56e-10 6.26e-07
OXCT1 2.37 6.31 8.34 6.98e-10 6.33e-07Male vs Female in Fetal samples
topTreat(treat.cardio,coef=4,n=20,p.value=0.05)[,-c(1:3)] GENENAME CHR logFC
BMP10 bone morphogenetic protein 10 2 -8.81
ZNF385B zinc finger protein 385B 2 -4.13
FLG-AS1 FLG antisense RNA 1 1 3.62
APOA2 apolipoprotein A2 1 -4.30
SYNPR synaptoporin 3 -3.64
SHOX2 short stature homeobox 2 3 -6.81
FGB fibrinogen beta chain 4 -3.98
SLC5A12 solute carrier family 5 member 12 11 -5.03
CDH10 cadherin 10 5 -4.03
GSG1L GSG1 like 16 -4.16
EPHA4 EPH receptor A4 2 -3.38
VWDE von Willebrand factor D and EGF domains 7 -3.92
NTM neurotrimin 11 -3.42
IRF4 interferon regulatory factor 4 6 -3.64
PLCB1 phospholipase C beta 1 20 -3.13
TUSC8 tumor suppressor candidate 8 13 -4.20
TDGF1 teratocarcinoma-derived growth factor 1 3 7.13
CHST13 carbohydrate sulfotransferase 13 3 4.16
GNAO1 G protein subunit alpha o1 16 -4.53
KCNJ3 potassium inwardly rectifying channel subfamily J member 3 2 -5.86
AveExpr t P.Value adj.P.Val
BMP10 -1.817 -15.40 9.09e-17 1.65e-12
ZNF385B 3.514 -10.70 1.74e-12 1.58e-08
FLG-AS1 5.463 9.44 3.93e-11 2.38e-07
APOA2 -2.107 -8.66 3.01e-10 1.17e-06
SYNPR 2.256 -8.63 3.22e-10 1.17e-06
SHOX2 0.382 -7.62 5.23e-09 1.58e-05
FGB -2.137 -7.52 6.60e-09 1.71e-05
SLC5A12 0.082 -7.39 9.76e-09 2.21e-05
CDH10 1.059 -7.22 1.55e-08 3.12e-05
GSG1L 2.274 -7.11 2.14e-08 3.58e-05
EPHA4 5.297 -7.10 2.17e-08 3.58e-05
VWDE 0.683 -7.01 2.80e-08 4.23e-05
NTM 5.453 -6.72 6.44e-08 8.77e-05
IRF4 0.196 -6.70 6.77e-08 8.77e-05
PLCB1 8.801 -6.41 1.56e-07 1.88e-04
TUSC8 -1.739 -6.38 1.73e-07 1.92e-04
TDGF1 -0.891 6.38 1.80e-07 1.92e-04
CHST13 -1.380 6.19 2.98e-07 3.00e-04
GNAO1 3.968 -6.16 3.25e-07 3.11e-04
KCNJ3 1.490 -6.06 4.44e-07 3.97e-04Male vs Female in ND samples
topTreat(treat.cardio,coef=5,n=20,p.value=0.05)[,-c(1:3)] GENENAME CHR logFC AveExpr
SH2D5 SH2 domain containing 5 1 -4.62 -2.1310
LINC02506 long intergenic non-protein coding RNA 2506 4 -5.03 0.7491
SLC38A8 solute carrier family 38 member 8 16 -5.64 0.0475
ERVH-1 endogenous retrovirus group H member 1 4 -4.34 -1.4055
ABCC3 ATP binding cassette subfamily C member 3 17 -3.55 2.0443
C4orf54 chromosome 4 open reading frame 54 4 -4.59 -1.0228
DSCAM DS cell adhesion molecule 21 -2.92 3.3473
HMGCS2 3-hydroxy-3-methylglutaryl-CoA synthase 2 1 -4.75 -0.4537
LINC01147 long intergenic non-protein coding RNA 1147 14 -4.48 -1.3744
ELOVL6 ELOVL fatty acid elongase 6 4 -2.37 4.7006
MCTP2 multiple C2 and transmembrane domain containing 2 15 -3.93 3.1142
LINC02542 long intergenic non-protein coding RNA 2542 6 -2.56 2.0989
NECTIN1 nectin cell adhesion molecule 1 11 -1.90 3.3294
RALYL RALY RNA binding protein like 8 -3.03 4.3428
EHD3 EH domain containing 3 2 -2.41 3.0910
CHST13 carbohydrate sulfotransferase 13 3 3.58 -1.3800
LINC00326 long intergenic non-protein coding RNA 326 6 -3.70 -1.7428
ARRDC4 arrestin domain containing 4 15 -2.67 3.1326
LUCAT1 lung cancer associated transcript 1 5 -4.20 2.9465
MRGPRX2 MAS related GPR family member X2 11 -3.35 -1.4578
t P.Value adj.P.Val
SH2D5 -9.12 9.08e-11 1.65e-06
LINC02506 -7.85 2.67e-09 2.42e-05
SLC38A8 -7.60 5.47e-09 3.31e-05
ERVH-1 -6.58 9.72e-08 4.41e-04
ABCC3 -5.89 7.14e-07 2.42e-03
C4orf54 -5.85 8.00e-07 2.42e-03
DSCAM -5.65 1.44e-06 3.60e-03
HMGCS2 -5.62 1.59e-06 3.60e-03
LINC01147 -5.42 2.82e-06 5.46e-03
ELOVL6 -5.40 3.01e-06 5.46e-03
MCTP2 -5.36 3.33e-06 5.49e-03
LINC02542 -4.98 1.02e-05 1.54e-02
NECTIN1 -4.80 1.71e-05 2.20e-02
RALYL -4.78 1.82e-05 2.20e-02
EHD3 -4.76 1.92e-05 2.20e-02
CHST13 4.76 1.94e-05 2.20e-02
LINC00326 -4.74 2.08e-05 2.22e-02
ARRDC4 -4.66 2.62e-05 2.64e-02
LUCAT1 -4.60 3.18e-05 3.03e-02
MRGPRX2 -4.47 4.47e-05 3.71e-02Male vs Female in DCM samples
topTreat(treat.cardio,coef=6,n=20,p.value=0.05)[,-c(1:3)] GENENAME CHR logFC
RSBN1 round spermatid basic protein 1 1 3.44
C4orf54 chromosome 4 open reading frame 54 4 7.32
MYH9 myosin heavy chain 9 22 3.52
ATP6V1FNB ATP6V1F neighbor 7 8.14
ATP6V1F ATPase H+ transporting V1 subunit F 7 5.88
DNAJA4 DnaJ heat shock protein family (Hsp40) member A4 15 4.19
MAPK8IP3 mitogen-activated protein kinase 8 interacting protein 3 16 2.45
FYTTD1 forty-two-three domain containing 1 3 2.37
USP47 ubiquitin specific peptidase 47 11 1.84
USP12 ubiquitin specific peptidase 12 13 2.84
EIF2AK3 eukaryotic translation initiation factor 2 alpha kinase 3 2 3.73
ADIPOQ adiponectin, C1Q and collagen domain containing 3 5.44
PI4KB phosphatidylinositol 4-kinase beta 1 2.68
C3orf52 chromosome 3 open reading frame 52 3 4.51
LINC01632 long intergenic non-protein coding RNA 1632 1 6.38
MBD4 methyl-CpG binding domain 4, DNA glycosylase 3 2.56
ASCC2 activating signal cointegrator 1 complex subunit 2 22 2.10
CNN1 calponin 1 19 6.14
HIRA histone cell cycle regulator 22 2.35
KCP kielin cysteine rich BMP regulator 7 5.15
AveExpr t P.Value adj.P.Val
RSBN1 5.854 20.9 1.11e-20 2.02e-16
C4orf54 -1.023 18.2 7.10e-19 6.44e-15
MYH9 7.950 16.1 2.24e-17 1.36e-13
ATP6V1FNB 0.191 15.0 1.98e-16 8.74e-13
ATP6V1F 3.401 14.9 2.41e-16 8.74e-13
DNAJA4 3.630 13.4 4.71e-15 1.42e-11
MAPK8IP3 6.341 13.1 8.65e-15 2.24e-11
FYTTD1 5.506 11.1 6.62e-13 1.28e-09
USP47 8.319 11.1 6.68e-13 1.28e-09
USP12 6.781 11.1 7.04e-13 1.28e-09
EIF2AK3 6.738 10.9 1.02e-12 1.67e-09
ADIPOQ -1.058 10.9 1.11e-12 1.67e-09
PI4KB 5.697 10.7 1.60e-12 2.23e-09
C3orf52 3.165 10.7 1.87e-12 2.43e-09
LINC01632 0.304 10.6 2.33e-12 2.81e-09
MBD4 4.719 10.6 2.51e-12 2.84e-09
ASCC2 5.603 10.4 3.23e-12 3.33e-09
CNN1 3.415 10.4 3.31e-12 3.33e-09
HIRA 4.442 10.3 4.24e-12 4.04e-09
KCP 2.458 10.3 4.80e-12 4.35e-09Interaction of sex differences between DCM and Fetal
topTreat(treat.cardio,coef=7,n=20,p.value=0.05)[,-c(1:3)] GENENAME CHR
RSBN1 round spermatid basic protein 1 1
BMP10 bone morphogenetic protein 10 2
MYH9 myosin heavy chain 9 22
SYNPR synaptoporin 3
ZDHHC2 zinc finger DHHC-type palmitoyltransferase 2 8
MAPK8IP3 mitogen-activated protein kinase 8 interacting protein 3 16
ZNF385B zinc finger protein 385B 2
LINC01411 long intergenic non-protein coding RNA 1411 5
HS3ST3A1 heparan sulfate-glucosamine 3-sulfotransferase 3A1 17
DNAJA4 DnaJ heat shock protein family (Hsp40) member A4 15
HIRA histone cell cycle regulator 22
USP47 ubiquitin specific peptidase 47 11
ABCG2 ATP binding cassette subfamily G member 2 (Junior blood group) 4
FLG-AS1 FLG antisense RNA 1 1
PAM peptidylglycine alpha-amidating monooxygenase 5
VASH1 vasohibin 1 14
EYA4 EYA transcriptional coactivator and phosphatase 4 6
WEE1 WEE1 G2 checkpoint kinase 11
FGB fibrinogen beta chain 4
PI4KB phosphatidylinositol 4-kinase beta 1
logFC AveExpr t P.Value adj.P.Val
RSBN1 3.46 5.85 12.95 1.13e-14 2.06e-10
BMP10 11.40 -1.82 12.07 8.28e-14 7.51e-10
MYH9 3.51 7.95 9.86 1.35e-11 8.17e-08
SYNPR 5.95 2.26 9.75 1.81e-11 8.20e-08
ZDHHC2 3.58 5.35 9.31 5.50e-11 1.94e-07
MAPK8IP3 2.61 6.34 9.25 6.40e-11 1.94e-07
ZNF385B 5.53 3.51 8.95 1.40e-10 3.62e-07
LINC01411 5.94 1.15 8.69 2.84e-10 5.97e-07
HS3ST3A1 8.35 2.78 8.68 2.96e-10 5.97e-07
DNAJA4 4.47 3.63 8.36 6.66e-10 1.21e-06
HIRA 2.73 4.44 8.14 1.21e-09 1.99e-06
USP47 1.96 8.32 8.08 1.40e-09 2.07e-06
ABCG2 4.64 4.52 8.07 1.48e-09 2.07e-06
FLG-AS1 -3.97 5.46 -8.03 1.62e-09 2.10e-06
PAM 3.14 8.94 7.93 2.12e-09 2.37e-06
VASH1 6.59 4.83 7.91 2.31e-09 2.37e-06
EYA4 6.75 4.62 7.91 2.33e-09 2.37e-06
WEE1 3.20 4.88 7.89 2.35e-09 2.37e-06
FGB 6.23 -2.14 7.81 3.07e-09 2.93e-06
PI4KB 2.95 5.70 7.61 5.23e-09 4.71e-06Interaction of sex differences between ND and Fetal
topTreat(treat.cardio,coef=8,n=20,p.value=0.05)[,-c(1:3)] GENENAME CHR logFC AveExpr
SYNPR synaptoporin 3 4.72 2.2559
BMP10 bone morphogenetic protein 10 2 6.51 -1.8175
SH2D5 SH2 domain containing 5 1 -5.50 -2.1310
FLG-AS1 FLG antisense RNA 1 1 -3.11 5.4629
NR2F2-AS1 NR2F2 antisense RNA 1 15 5.23 8.1192
APOA2 apolipoprotein A2 1 4.64 -2.1066
PLCB1 phospholipase C beta 1 20 4.68 8.8009
ERVH-1 endogenous retrovirus group H member 1 4 -4.44 -1.4055
MT1H metallothionein 1H 16 5.90 -1.9453
A1BG-AS1 A1BG antisense RNA 1 19 6.23 1.8006
CAMK1D calcium/calmodulin dependent protein kinase ID 10 4.13 7.3127
FGB fibrinogen beta chain 4 4.32 -2.1375
NTM neurotrimin 11 3.99 5.4529
LINC01941 long intergenic non-protein coding RNA 1941 2 -4.29 -2.0824
NECTIN1 nectin cell adhesion molecule 1 11 -2.44 3.3294
HOGA1 4-hydroxy-2-oxoglutarate aldolase 1 10 -4.85 -2.0994
SLC38A8 solute carrier family 38 member 8 16 -5.52 0.0475
NFASC neurofascin 1 6.40 5.0515
JAKMIP2 janus kinase and microtubule interacting protein 2 5 3.92 3.3628
SHOX2 short stature homeobox 2 3 7.90 0.3817
t P.Value adj.P.Val
SYNPR 6.58 9.73e-08 0.00094
BMP10 6.55 1.08e-07 0.00094
SH2D5 -6.42 1.55e-07 0.00094
FLG-AS1 -5.89 7.03e-07 0.00299
NR2F2-AS1 5.81 9.32e-07 0.00299
APOA2 5.78 9.89e-07 0.00299
PLCB1 5.67 1.39e-06 0.00359
ERVH-1 -5.46 2.53e-06 0.00573
MT1H 5.16 6.39e-06 0.01287
A1BG-AS1 5.04 9.24e-06 0.01559
CAMK1D 4.98 1.05e-05 0.01559
FGB 4.96 1.10e-05 0.01559
NTM 4.95 1.12e-05 0.01559
LINC01941 -4.89 1.34e-05 0.01741
NECTIN1 -4.83 1.57e-05 0.01741
HOGA1 -4.83 1.62e-05 0.01741
SLC38A8 -4.79 1.87e-05 0.01741
NFASC 4.79 1.95e-05 0.01741
JAKMIP2 4.76 1.96e-05 0.01741
SHOX2 4.79 2.02e-05 0.01741Interaction of sex differences between DCM and ND
topTreat(treat.cardio,coef=9,n=20,p.value=0.05)[,-c(1:3)] GENENAME CHR logFC
C4orf54 chromosome 4 open reading frame 54 4 11.91
RSBN1 round spermatid basic protein 1 1 3.42
MYH9 myosin heavy chain 9 22 4.25
ASCC2 activating signal cointegrator 1 complex subunit 2 22 2.75
DNAJA4 DnaJ heat shock protein family (Hsp40) member A4 15 5.05
MAPK8IP3 mitogen-activated protein kinase 8 interacting protein 3 16 2.62
EYA4 EYA transcriptional coactivator and phosphatase 4 6 7.21
BAG3 BAG cochaperone 3 10 3.42
ATP2B4 ATPase plasma membrane Ca2+ transporting 4 1 3.64
LMCD1 LIM and cysteine rich domains 1 3 6.31
MET MET proto-oncogene, receptor tyrosine kinase 7 4.35
SPON1-AS1 SPON1 antisense RNA 1 11 4.20
ATP6V1FNB ATP6V1F neighbor 7 10.80
ATP6V1F ATPase H+ transporting V1 subunit F 7 5.85
USP12 ubiquitin specific peptidase 12 13 3.10
LRRC8B leucine rich repeat containing 8 VRAC subunit B 1 3.86
ADAM19 ADAM metallopeptidase domain 19 5 4.42
FYTTD1 forty-two-three domain containing 1 3 2.59
PI4KB phosphatidylinositol 4-kinase beta 1 2.98
ANKRD13A ankyrin repeat domain 13A 12 2.67
AveExpr t P.Value adj.P.Val
C4orf54 -1.023 14.39 6.52e-16 1.18e-11
RSBN1 5.854 11.92 1.06e-13 9.64e-10
MYH9 7.950 11.16 5.91e-13 3.58e-09
ASCC2 5.603 9.13 8.77e-11 3.98e-07
DNAJA4 3.630 8.83 1.91e-10 6.92e-07
MAPK8IP3 6.341 8.64 3.18e-10 9.60e-07
EYA4 4.620 8.12 1.34e-09 3.47e-06
BAG3 4.267 7.98 1.85e-09 4.19e-06
ATP2B4 7.967 7.86 2.59e-09 4.42e-06
LMCD1 5.509 7.87 2.61e-09 4.42e-06
MET 2.883 7.85 2.68e-09 4.42e-06
SPON1-AS1 2.903 7.73 3.76e-09 5.69e-06
ATP6V1FNB 0.191 7.58 6.32e-09 8.81e-06
ATP6V1F 3.401 7.49 7.41e-09 8.88e-06
USP12 6.781 7.48 7.43e-09 8.88e-06
LRRC8B 5.691 7.45 8.10e-09 8.88e-06
ADAM19 6.786 7.44 8.32e-09 8.88e-06
FYTTD1 5.506 7.34 1.11e-08 1.08e-05
PI4KB 5.697 7.33 1.13e-08 1.08e-05
ANKRD13A 5.239 7.19 1.66e-08 1.50e-05par(mar=c(5,5,3,2))
plot(treat.cardio$coefficients[,1],treat.cardio$coefficients[,2],xlab="logFC: ND vs Fetal", ylab="logFC: DCM vs Fetal",main="Cardiomyocytes",col=rgb(0,0,1,alpha=0.25),pch=16,cex=0.8)
abline(h=0,v=0,col=colours()[c(175)])
sig.genes <- dt.cardio[,1] !=0 | dt.cardio[,2] != 0
text(treat.cardio$coefficients[sig.genes,1],treat.cardio$coefficients[sig.genes,2],labels=rownames(dt.cardio)[sig.genes],col=2,cex=0.6)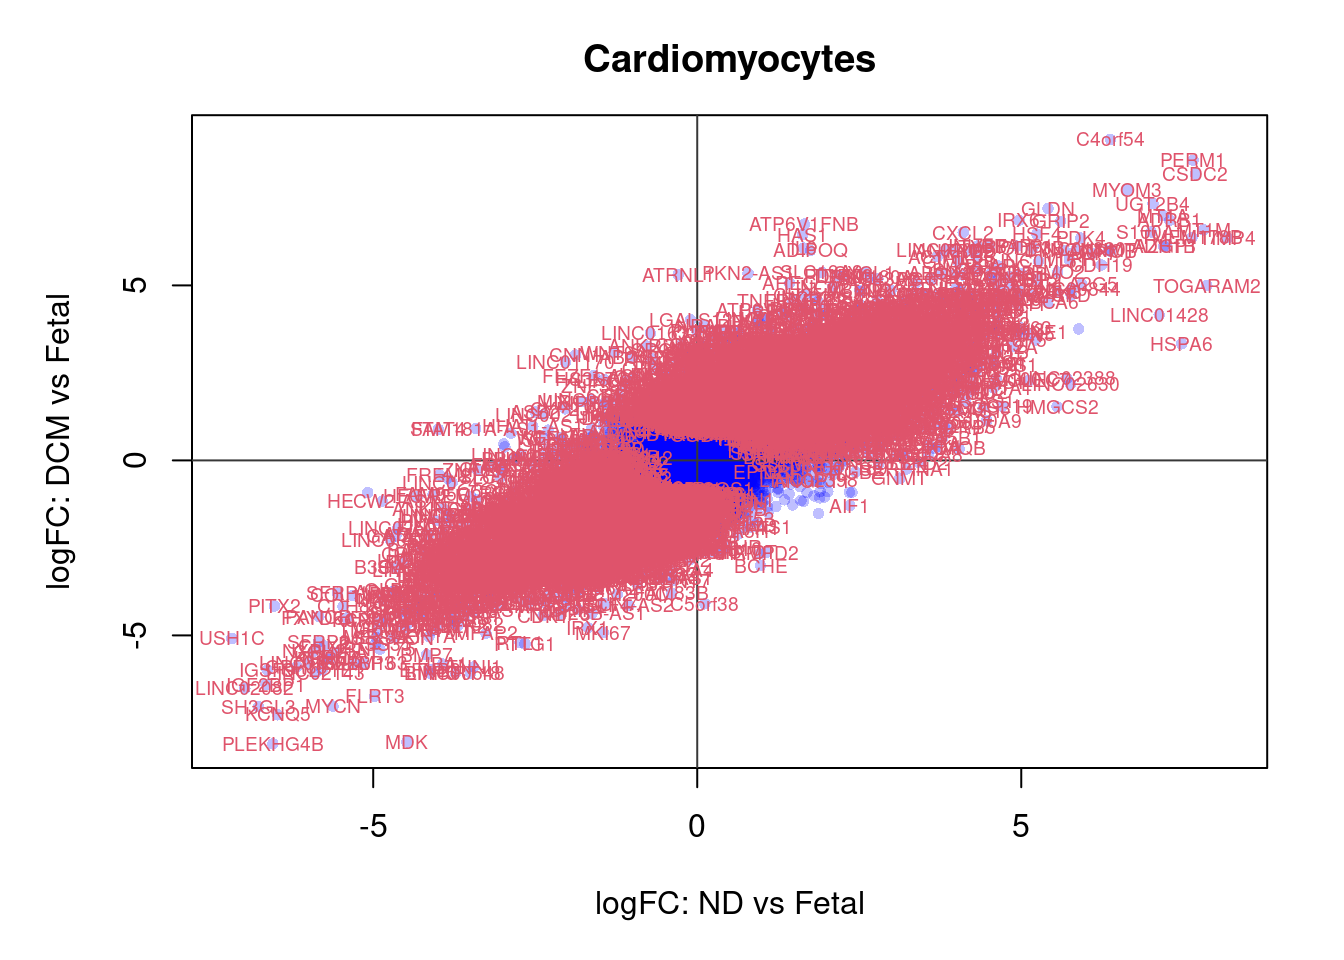
par(mar=c(5,5,3,2))
plot(treat.cardio$coefficients[,4],treat.cardio$coefficients[,5],xlab="logFC: Fetal Male vs Female", ylab="logFC: ND Male vs Female",main="Cardiomyocytes: Sex differences - Fetal and ND",col=rgb(0,0,1,alpha=0.25),pch=16,cex=0.8)
abline(h=0,v=0)
sig.genes <- dt.cardio[,4] !=0 | dt.cardio[,5] != 0
text(treat.cardio$coefficients[sig.genes,4],treat.cardio$coefficients[sig.genes,5],labels=rownames(dt.cardio)[sig.genes],col=2,cex=0.6)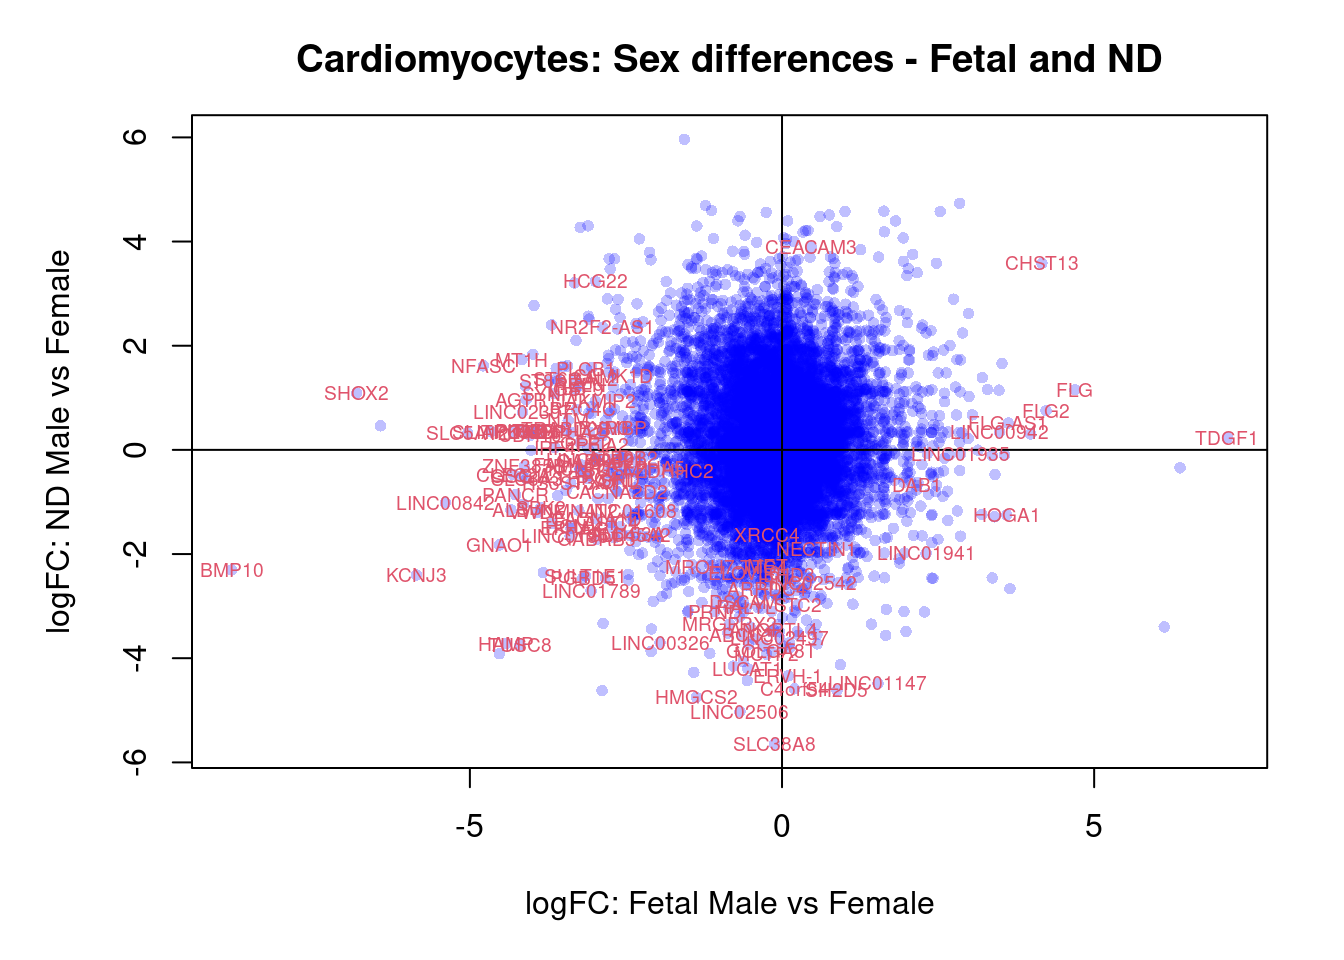
par(mar=c(5,5,3,2))
plot(treat.cardio$coefficients[,4],treat.cardio$coefficients[,6],xlab="logFC: Fetal Male vs Female", ylab="logFC: DCM Male vs Female",main="Cardiomyocytes: Sex differences - Fetal and DCM",col=rgb(0,0,1,alpha=0.25),pch=16,cex=0.8)
abline(h=0,v=0)
sig.genes <- dt.cardio[,4] !=0 | dt.cardio[,6] != 0
text(treat.cardio$coefficients[sig.genes,4],treat.cardio$coefficients[sig.genes,6],labels=rownames(dt.cardio)[sig.genes],col=2,cex=0.6)
par(mar=c(5,5,3,2))
plot(treat.cardio$coefficients[,5],treat.cardio$coefficients[,6],xlab="logFC: ND Male vs Female", ylab="logFC: DCM Male vs Female",main="Cardiomyocytes: Sex differences - ND and DCM",col=rgb(0,0,1,alpha=0.25),pch=16,cex=0.8)
sig.genes <- dt.cardio[,5] !=0 | dt.cardio[,6] != 0
text(treat.cardio$coefficients[sig.genes,5],treat.cardio$coefficients[sig.genes,6],labels=rownames(dt.cardio)[sig.genes],col=2,cex=0.6)
abline(h=0,v=0)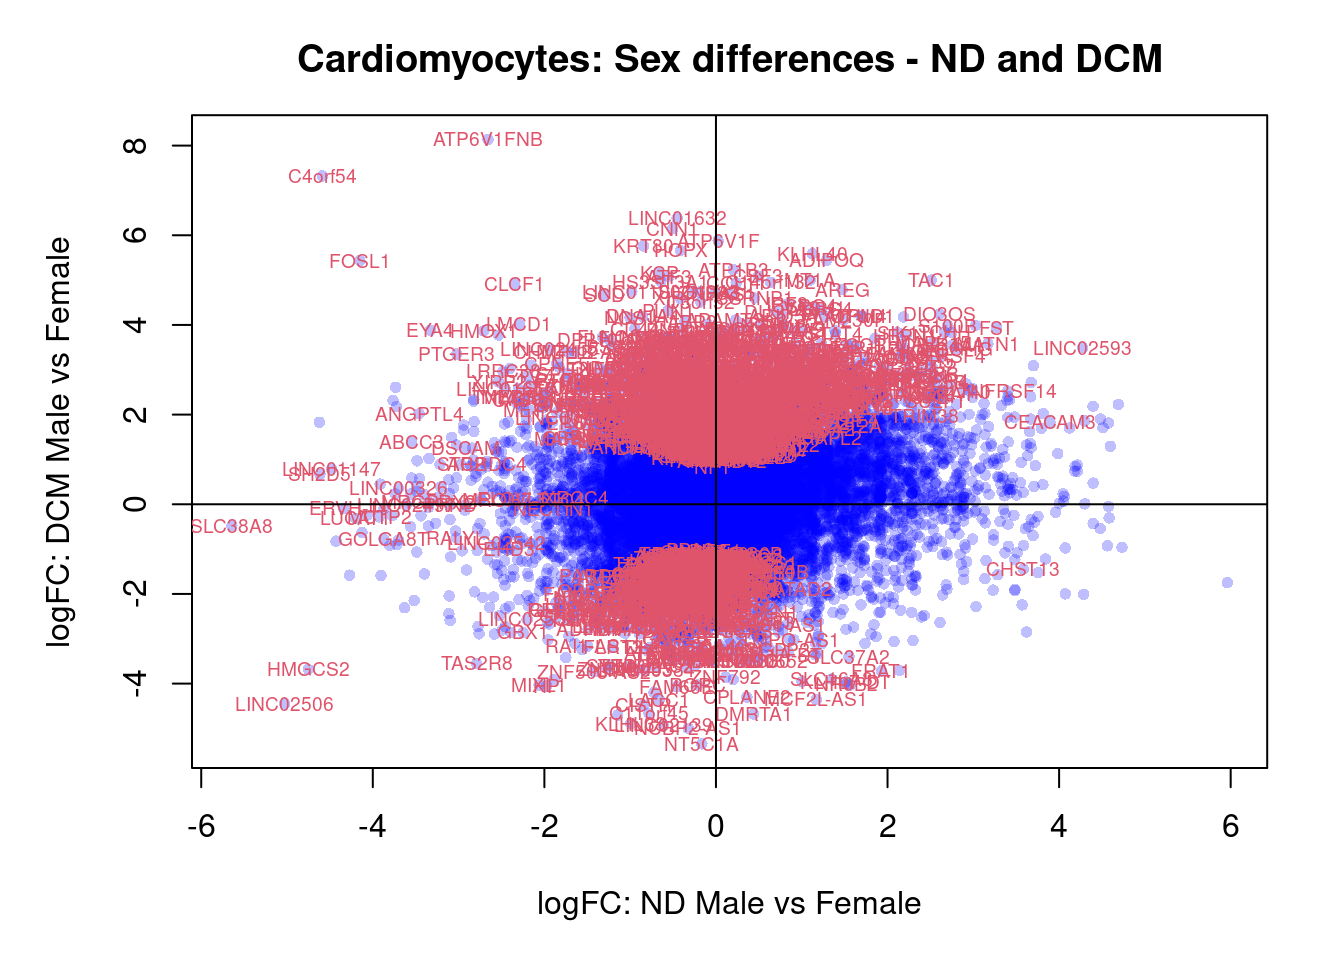
par(mar=c(5,5,3,2))
plot(treat.cardio$coefficients[,4],treat.cardio$coefficients[,5],xlab="logFC: Fetal Male vs Female", ylab="logFC: ND Male vs Female",main="Cardiomyocytes: Interaction term: Fetal vs ND",col=rgb(0,0,1,alpha=0.25),pch=16,cex=0.8)
abline(h=0,v=0)
sig.genes <- dt.cardio[,8] !=0
text(treat.cardio$coefficients[sig.genes,4],treat.cardio$coefficients[sig.genes,5],labels=rownames(dt.cardio)[sig.genes],col=2,cex=0.6)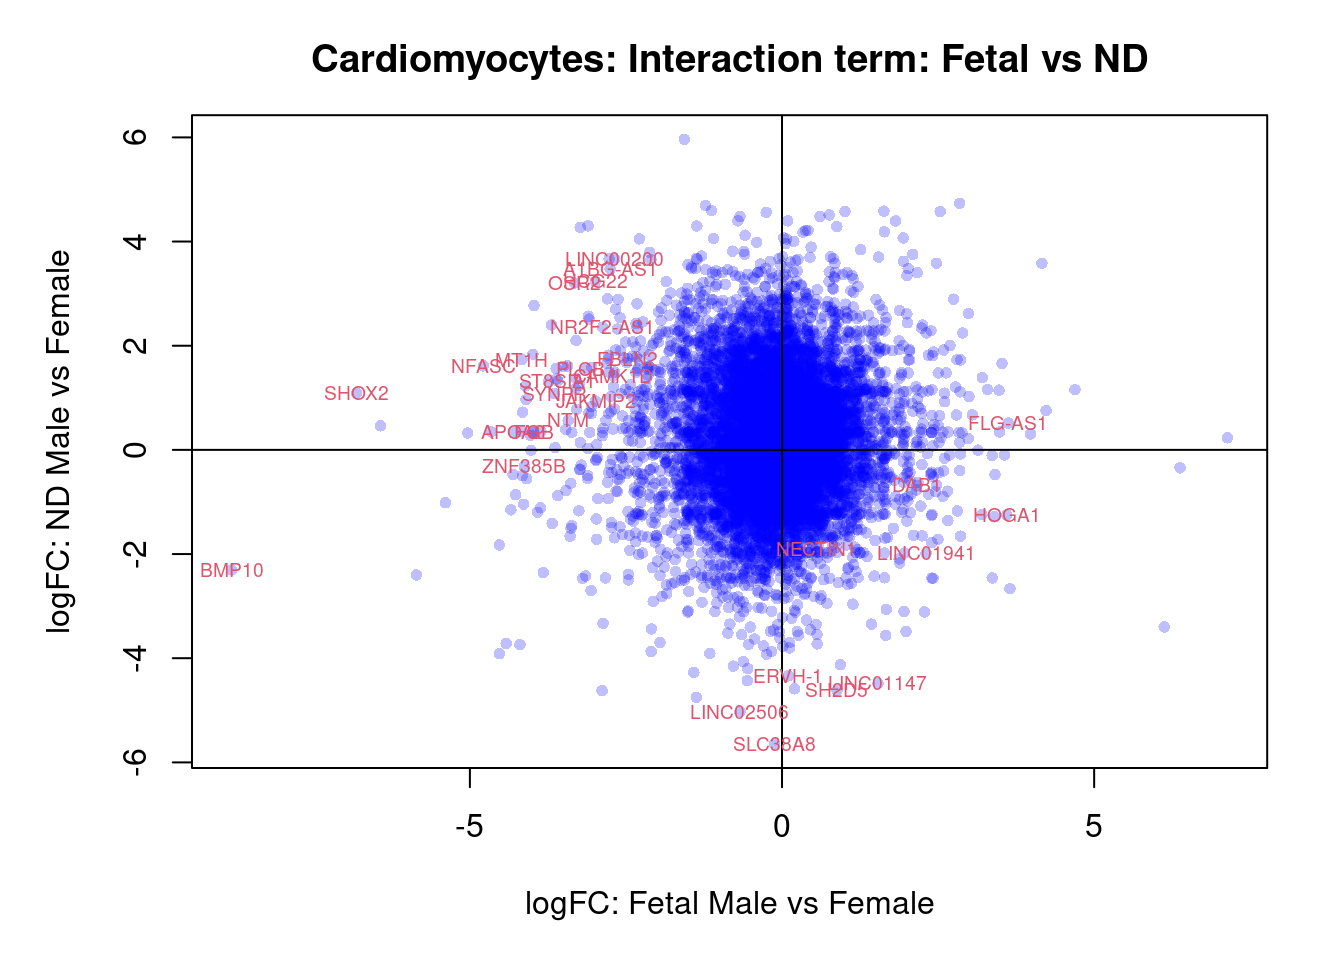
par(mar=c(5,5,3,2))
plot(treat.cardio$coefficients[,4],treat.cardio$coefficients[,6],xlab="logFC: Fetal Male vs Female", ylab="logFC: DCM Male vs Female",main="Cardiomyocytes: Interaction term: Fetal and DCM",col=rgb(0,0,1,alpha=0.25),pch=16,cex=0.8)
abline(h=0,v=0)
sig.genes <- dt.cardio[,7] !=0
text(treat.cardio$coefficients[sig.genes,4],treat.cardio$coefficients[sig.genes,6],labels=rownames(dt.cardio)[sig.genes],col=2,cex=0.6)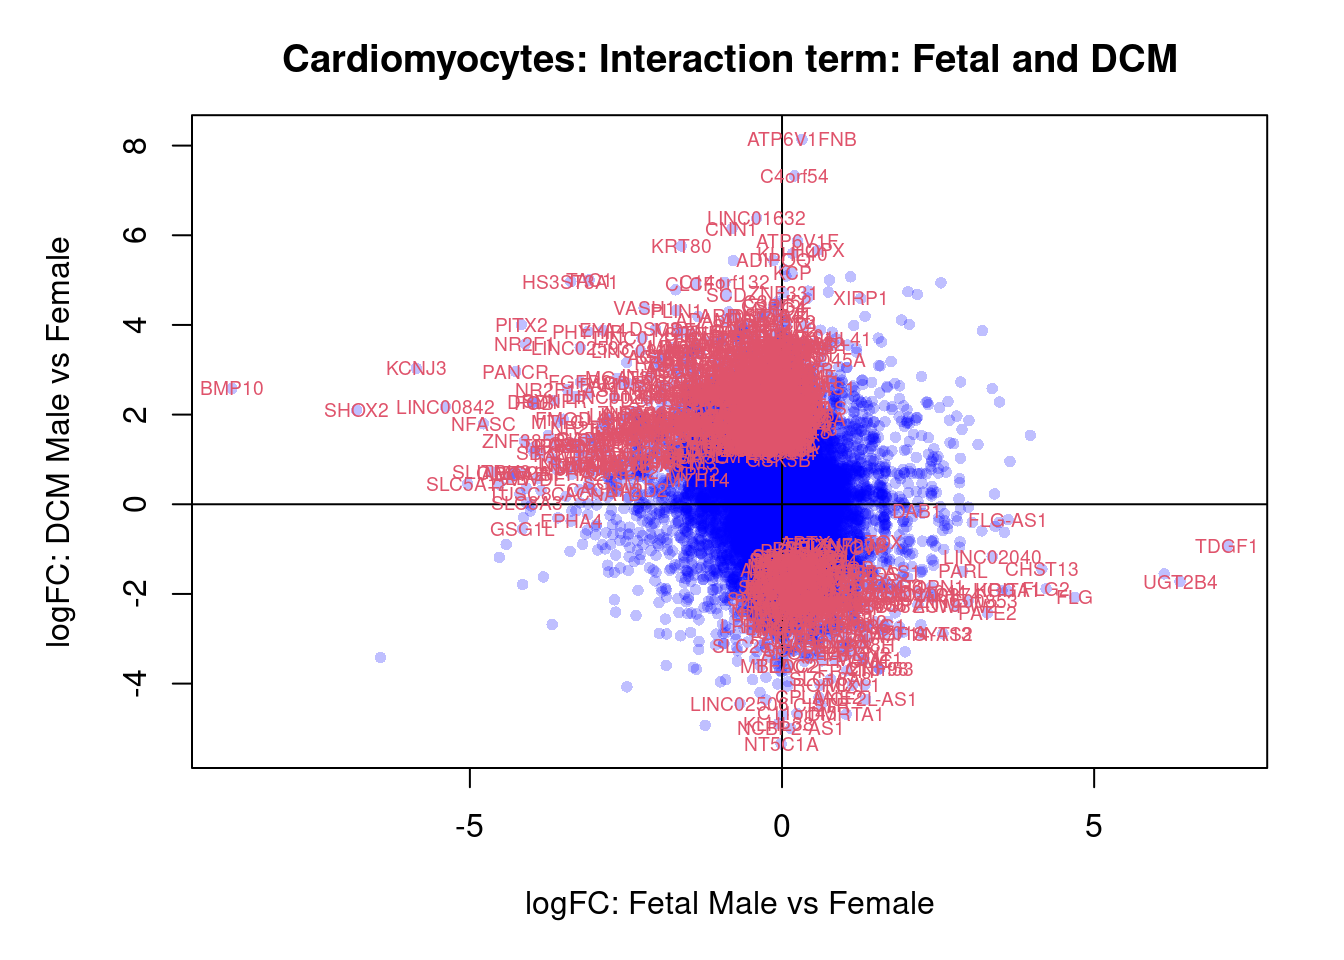
par(mar=c(5,5,3,2))
plot(treat.cardio$coefficients[,5],treat.cardio$coefficients[,6],xlab="logFC: ND Male vs Female", ylab="logFC: DCM Male vs Female",main="Cardiomyocytes: Interaction term: ND and DCM",col=rgb(0,0,1,alpha=0.25),pch=16,cex=0.8)
abline(h=0,v=0)
sig.genes <- dt.cardio[,9] !=0
text(treat.cardio$coefficients[sig.genes,5],treat.cardio$coefficients[sig.genes,6],labels=rownames(dt.cardio)[sig.genes],col=2,cex=0.6)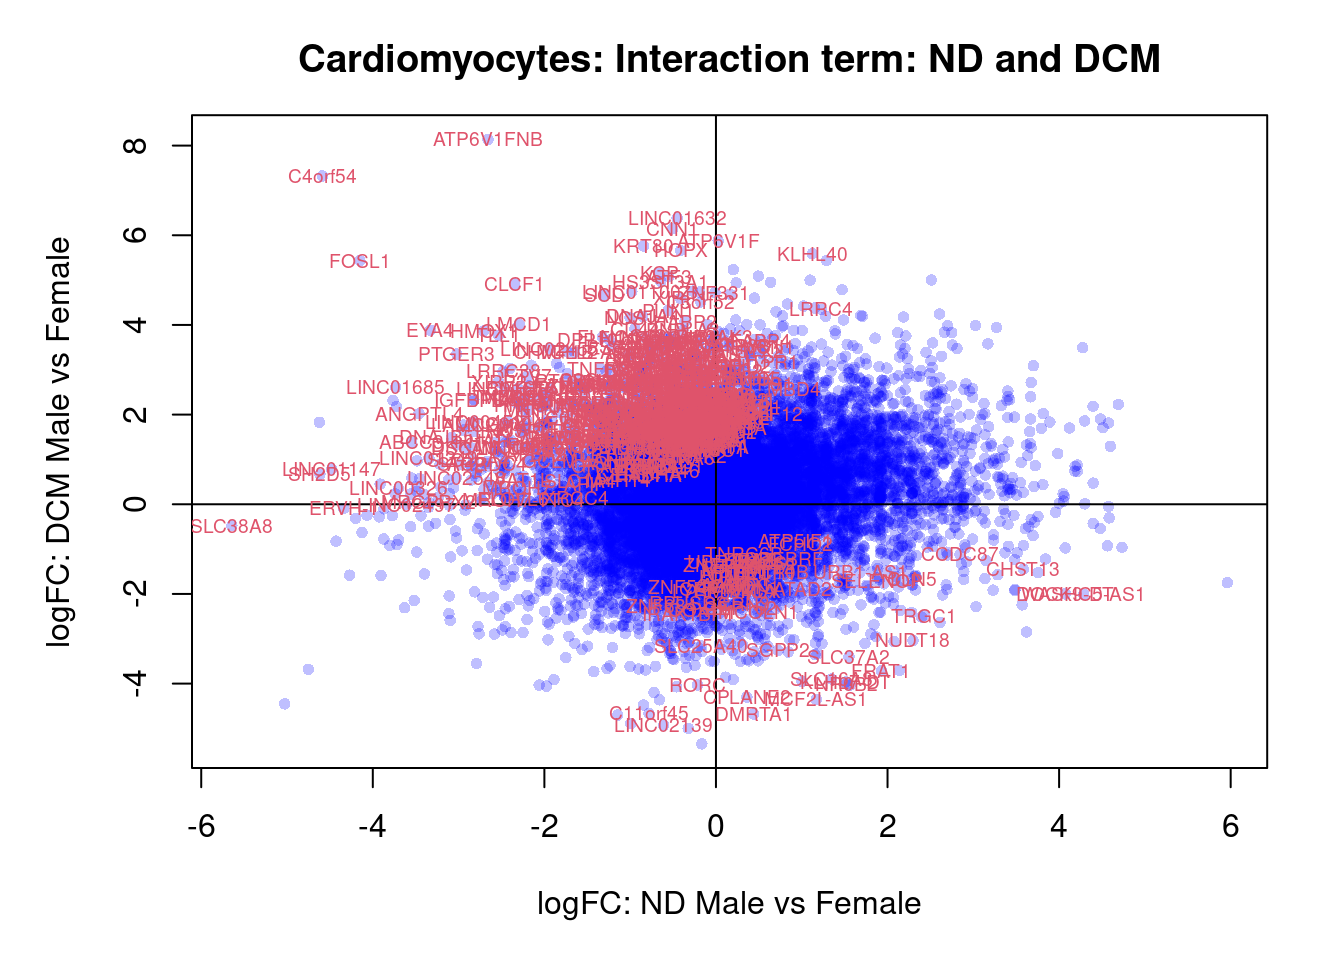
Pericytes
cont.peri <- makeContrasts(NvF = 0.5*(peri.ND.Male + peri.ND.Female) - 0.5*(peri.Fetal.Male + peri.Fetal.Female),
                         DvF = 0.5*(peri.DCM.Male + peri.DCM.Female) - 0.5*(peri.Fetal.Male + peri.Fetal.Female),
                         DvN = 0.5*(peri.DCM.Male + peri.DCM.Female) - 0.5*(peri.ND.Male + peri.ND.Female),
                         SexFetal = peri.Fetal.Male - peri.Fetal.Female,
                         SexND = peri.ND.Male - peri.ND.Female,
                         SexDCM = peri.DCM.Male - peri.DCM.Female,
                         InteractionDF = (peri.DCM.Male - peri.Fetal.Male) - (peri.DCM.Female - peri.Fetal.Female),
                         InteractionNF = (peri.ND.Male - peri.Fetal.Male) - (peri.ND.Female - peri.Fetal.Female),
                         InteractionDN = (peri.DCM.Male - peri.ND.Male) - (peri.DCM.Female - peri.ND.Female),
                         levels=design)
fit.peri <- contrasts.fit(fit,contrasts = cont.peri)
fit.peri <- eBayes(fit.peri,robust=TRUE)

summary(decideTests(fit.peri))
NvF DvF DvN SexFetal SexND SexDCM InteractionDF InteractionNF
Down 1502 1361 20 1 0 8 0 0
NotSig 15628 15607 18101 18140 18141 18121 18140 18141
Up 1011 1173 20 0 0 12 1 0
InteractionDN
Down 0
NotSig 18141
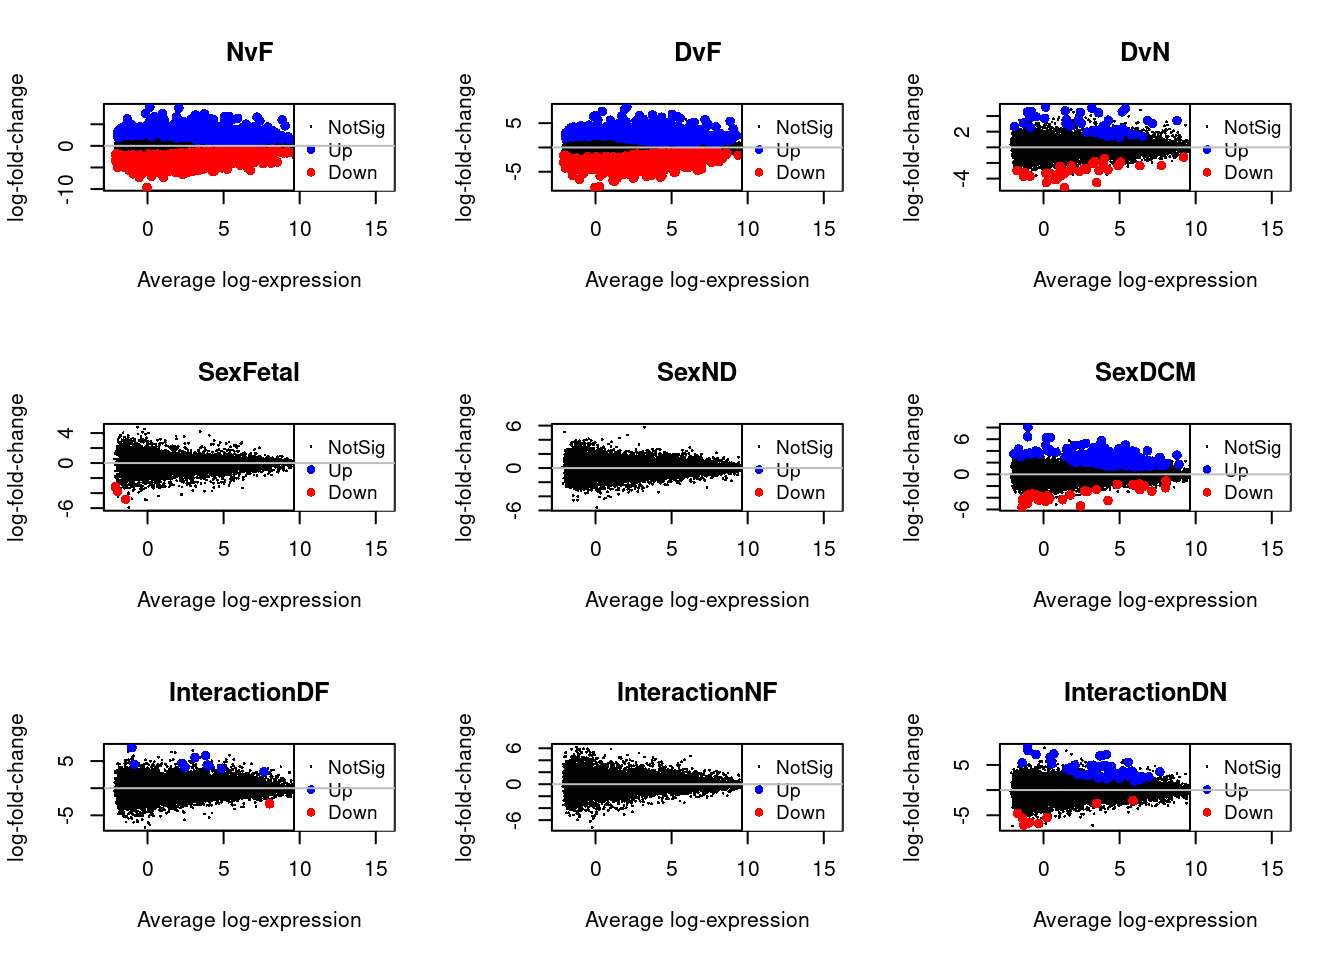
Up 0treat.peri <- treat(fit.peri,lfc=0.5)
dt.peri<-decideTests(treat.peri)
summary(dt.peri) NvF DvF DvN SexFetal SexND SexDCM InteractionDF InteractionNF
Down 917 608 1 1 0 3 0 0
NotSig 16858 17202 18135 18140 18141 18132 18140 18141
Up 366 331 5 0 0 6 1 0
InteractionDN
Down 0
NotSig 18141
Up 0par(mfrow=c(3,3))
for(i in 1:9){
plotMD(treat.peri,coef=i,status=dt.peri[,i],hl.col=c("blue","red"))
abline(h=0,col="grey")
}
par(mfrow=c(1,1))
par(mar=c(7,4,2,2))
barplot(summary(dt.peri)[-2,],beside=TRUE,legend=TRUE,col=c("blue","red"),ylab="Number of significant genes",las=2)
title("Pericytes")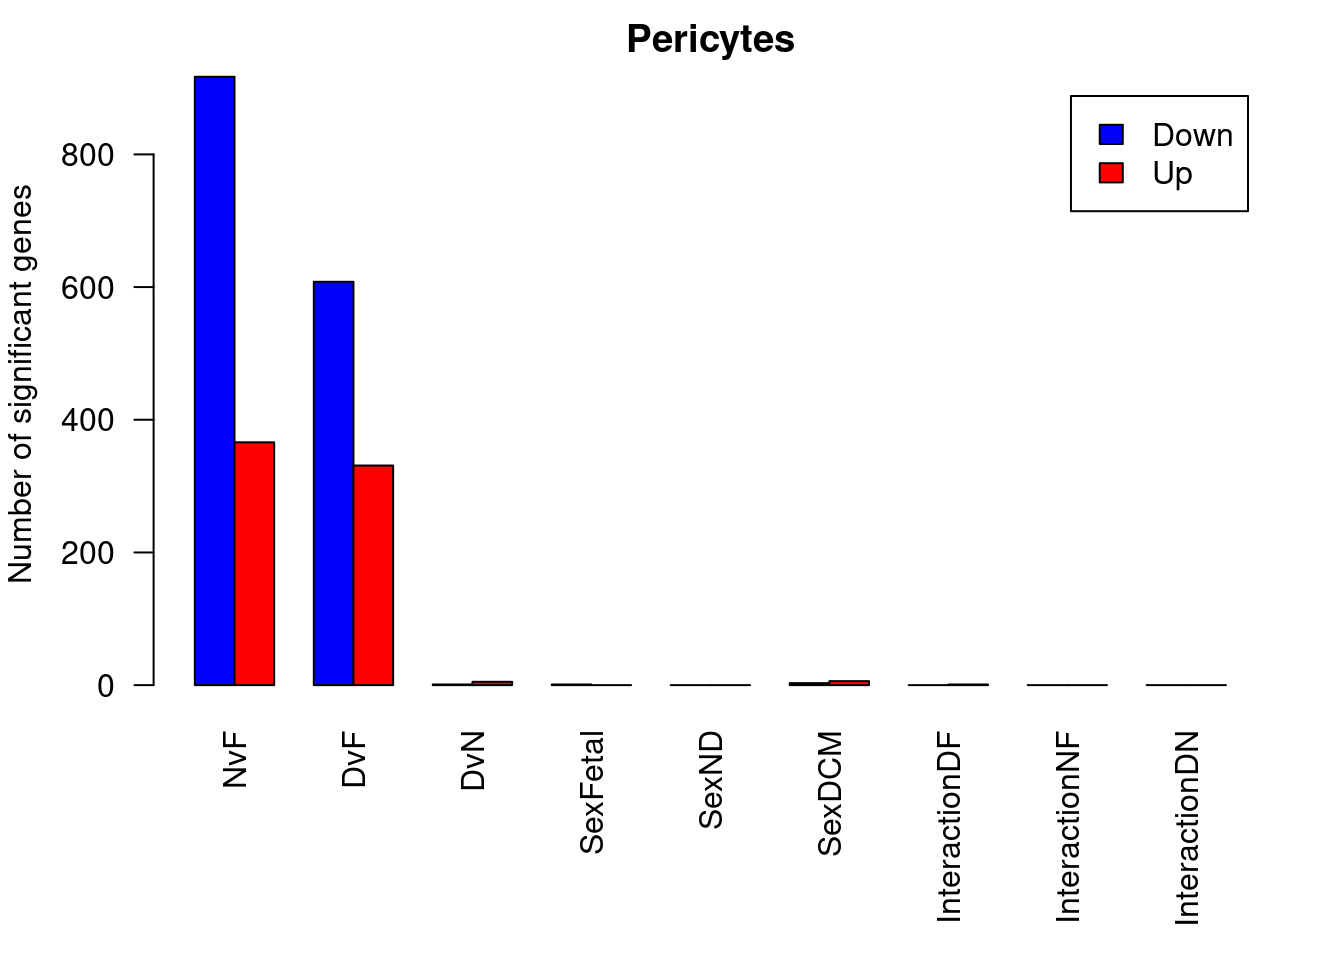
ND vs Fetal
options(digits=3)
topTreat(treat.peri,coef=1,n=20,p.value=0.05)[,-c(1:3)]
GENENAME CHR logFC
IGF2BP1 insulin like growth factor 2 mRNA binding protein 1 17 -6.53
CNTNAP2 contactin associated protein 2 7 -5.51
SULT1E1 sulfotransferase family 1E member 1 4 -7.36
PRSS35 serine protease 35 6 -4.91
EGFLAM EGF like, fibronectin type III and laminin G domains 5 3.94
FRMD3 FERM domain containing 3 9 2.73
IGF2BP3 insulin like growth factor 2 mRNA binding protein 3 7 -5.27
SCN3A sodium voltage-gated channel alpha subunit 3 2 6.98
ADAMTS19 ADAM metallopeptidase with thrombospondin type 1 motif 19 5 -7.06
ABCA5 ATP binding cassette subfamily A member 5 17 3.34
WNT6 Wnt family member 6 2 7.62
SPARCL1 SPARC like 1 4 4.63
EFHD1 EF-hand domain family member D1 2 4.18
FAM151A family with sequence similarity 151 member A 1 -5.22
IGF2BP2 insulin like growth factor 2 mRNA binding protein 2 3 -4.26
PIEZO2 piezo type mechanosensitive ion channel component 2 18 -5.56
MOCS1 molybdenum cofactor synthesis 1 6 3.06
E2F7 E2F transcription factor 7 12 -6.06
GDF6 growth differentiation factor 6 8 -5.86
ADIRF adipogenesis regulatory factor 10 5.13
AveExpr t P.Value adj.P.Val
IGF2BP1 1.4304 -10.27 5.03e-12 9.13e-08
CNTNAP2 6.4490 -9.63 2.43e-11 2.20e-07
SULT1E1 -0.0273 -9.34 5.23e-11 2.58e-07
PRSS35 1.2339 -9.30 5.69e-11 2.58e-07
EGFLAM 5.5354 9.19 7.45e-11 2.70e-07
FRMD3 7.6336 8.71 2.61e-10 7.00e-07
IGF2BP3 4.2625 -8.70 2.70e-10 7.00e-07
SCN3A 2.8488 8.62 3.46e-10 7.84e-07
ADAMTS19 4.5895 -8.55 4.13e-10 8.33e-07
ABCA5 6.0513 8.44 5.35e-10 9.52e-07
WNT6 0.4611 8.43 5.77e-10 9.52e-07
SPARCL1 8.4369 8.30 7.85e-10 1.19e-06
EFHD1 4.3005 8.16 1.13e-09 1.44e-06
FAM151A 1.4899 -8.16 1.17e-09 1.44e-06
IGF2BP2 6.8811 -8.13 1.25e-09 1.44e-06
PIEZO2 4.5298 -8.13 1.27e-09 1.44e-06
MOCS1 3.8437 8.03 1.61e-09 1.65e-06
E2F7 1.3382 -8.04 1.63e-09 1.65e-06
GDF6 0.7663 -7.98 1.92e-09 1.79e-06
ADIRF 4.3855 7.96 1.97e-09 1.79e-06DCM vs Fetal
topTreat(treat.peri,coef=2,n=20,p.value=0.05)[,-c(1:3)] GENENAME CHR logFC
SULT1E1 sulfotransferase family 1E member 1 4 -9.63
PRSS35 serine protease 35 6 -5.44
CNTNAP2 contactin associated protein 2 7 -4.50
SPC24 SPC24 component of NDC80 kinetochore complex 19 -5.25
NCAPG non-SMC condensin I complex subunit G 4 -6.26
IGF2BP1 insulin like growth factor 2 mRNA binding protein 1 17 -6.04
IGF2BP3 insulin like growth factor 2 mRNA binding protein 3 7 -4.51
SNX31 sorting nexin 31 8 4.77
TMEM26 transmembrane protein 26 10 -6.02
IGF2BP2 insulin like growth factor 2 mRNA binding protein 2 3 -3.68
NXPH2 neurexophilin 2 2 -6.13
ADAMTS19 ADAM metallopeptidase with thrombospondin type 1 motif 19 5 -5.64
CNGA1 cyclic nucleotide gated channel subunit alpha 1 4 4.16
EMC10 ER membrane protein complex subunit 10 19 -3.72
PIEZO2 piezo type mechanosensitive ion channel component 2 18 -3.66
KIF18B kinesin family member 18B 17 -6.48
EGFLAM EGF like, fibronectin type III and laminin G domains 5 3.44
MUC3A mucin 3A, cell surface associated 7 5.33
FAM151A family with sequence similarity 151 member A 1 -4.77
SGO1 shugoshin 1 3 -5.15
AveExpr t P.Value adj.P.Val
SULT1E1 -0.0273 -13.53 3.55e-15 6.44e-11
PRSS35 1.2339 -10.72 1.69e-12 1.53e-08
CNTNAP2 6.4490 -10.49 2.89e-12 1.74e-08
SPC24 1.9322 -10.38 3.85e-12 1.74e-08
NCAPG 1.5755 -9.66 2.28e-11 8.27e-08
IGF2BP1 1.4304 -9.55 3.00e-11 8.82e-08
IGF2BP3 4.2625 -9.47 3.69e-11 8.82e-08
SNX31 2.4069 9.45 3.89e-11 8.82e-08
TMEM26 0.2725 -8.47 5.03e-10 1.01e-06
IGF2BP2 6.8811 -8.35 6.93e-10 1.23e-06
NXPH2 1.1454 -8.33 7.44e-10 1.23e-06
ADAMTS19 4.5895 -8.16 1.16e-09 1.75e-06
CNGA1 2.5428 8.00 1.78e-09 2.48e-06
EMC10 6.0827 -7.93 2.13e-09 2.77e-06
PIEZO2 4.5298 -7.84 2.76e-09 3.22e-06
KIF18B 1.5040 -7.84 2.84e-09 3.22e-06
EGFLAM 5.5354 7.80 3.05e-09 3.25e-06
MUC3A 0.4008 7.76 3.42e-09 3.44e-06
FAM151A 1.4899 -7.66 4.49e-09 4.22e-06
SGO1 0.9381 -7.65 4.65e-09 4.22e-06DCM vs ND
topTreat(treat.peri,coef=3)[,-c(1:3)] GENENAME CHR logFC
ACTG2 actin gamma 2, smooth muscle 2 7.34
SULF1 sulfatase 1 8 5.02
MYH11 myosin heavy chain 11 16 4.74
SLC17A4 solute carrier family 17 member 4 6 -3.28
LINC01592 long intergenic non-protein coding RNA 1592 8 5.16
TNFRSF11B TNF receptor superfamily member 11b 8 6.01
SBSPON somatomedin B and thrombospondin type 1 domain containing 8 3.94
PTPRZ1 protein tyrosine phosphatase receptor type Z1 7 4.40
PRB2 proline rich protein BstNI subfamily 2 12 -3.49
MROH2B maestro heat like repeat family member 2B 5 -3.63
AveExpr t P.Value adj.P.Val
ACTG2 0.7060 6.79 5.59e-08 0.00101
SULF1 5.9248 5.92 6.58e-07 0.00547
MYH11 5.6836 5.81 9.05e-07 0.00547
SLC17A4 -1.7651 -5.49 2.29e-06 0.01038
LINC01592 1.4784 5.03 9.20e-06 0.03336
TNFRSF11B 1.2687 4.84 1.65e-05 0.04991
SBSPON 2.5178 4.71 2.26e-05 0.05547
PTPRZ1 3.4820 4.67 2.56e-05 0.05547
PRB2 1.2967 -4.64 2.75e-05 0.05547
MROH2B 0.0673 -4.53 3.88e-05 0.07031Male vs Female in Fetal samples
topTreat(treat.peri,coef=4)[,-c(1:3)] GENENAME CHR logFC AveExpr
NMUR2 neuromedin U receptor 2 5 -4.33 -1.433
ZNF385B zinc finger protein 385B 2 -3.41 3.514
ALB albumin 4 -4.32 -1.191
PATE2 prostate and testis expressed 2 11 -3.82 -1.682
OR7D2 olfactory receptor family 7 subfamily D member 2 19 3.37 -0.601
FLG-AS1 FLG antisense RNA 1 1 2.71 5.463
EPHA4 EPH receptor A4 2 -3.71 5.297
CLDN7 claudin 7 17 4.56 -0.478
GRM7 glutamate metabotropic receptor 7 3 -2.53 2.865
TDGF1 teratocarcinoma-derived growth factor 1 3 4.49 -0.891
t P.Value adj.P.Val
NMUR2 -5.54 2.00e-06 0.0362
ZNF385B -4.48 4.37e-05 0.3967
ALB -4.20 1.02e-04 0.5489
PATE2 -4.08 1.41e-04 0.5489
OR7D2 4.05 1.52e-04 0.5489
FLG-AS1 3.92 2.14e-04 0.5489
EPHA4 -3.93 2.16e-04 0.5489
CLDN7 3.90 2.42e-04 0.5489
GRM7 -3.53 6.45e-04 1.0000
TDGF1 3.46 8.42e-04 1.0000Male vs Female in ND samples
topTreat(treat.peri,coef=5)[,-c(1:3)] GENENAME CHR logFC
ZNF304 zinc finger protein 304 19 4.31
NXPH3 neurexophilin 3 17 4.53
CTXND2 cortexin domain containing 2 1 3.05
ALLC allantoicase 2 -3.40
SLC17A4 solute carrier family 17 member 4 6 -3.19
MELTF-AS1 MELTF antisense RNA 1 3 3.32
TESC-AS1 TESC antisense RNA 1 (head to head) 12 3.50
ITGA3 integrin subunit alpha 3 17 -2.62
MCM10 minichromosome maintenance 10 replication initiation factor 10 -3.86
ANO9 anoctamin 9 11 3.06
AveExpr t P.Value adj.P.Val
ZNF304 2.288 4.94 1.16e-05 0.210
NXPH3 0.316 4.54 3.81e-05 0.345
CTXND2 0.235 3.91 2.23e-04 1.000
ALLC 0.719 -3.84 2.76e-04 1.000
SLC17A4 -1.765 -3.76 3.42e-04 1.000
MELTF-AS1 0.922 3.66 4.59e-04 1.000
TESC-AS1 1.431 3.51 6.88e-04 1.000
ITGA3 4.632 -3.43 8.28e-04 1.000
MCM10 1.253 -3.38 9.94e-04 1.000
ANO9 0.661 3.35 1.04e-03 1.000Male vs Female in DCM samples
topTreat(treat.peri,coef=6)[,-c(1:3)] GENENAME CHR
GIPR gastric inhibitory polypeptide receptor 19
C4orf54 chromosome 4 open reading frame 54 4
EID2B EP300 interacting inhibitor of differentiation 2B 19
SGCZ sarcoglycan zeta 8
CDC7 cell division cycle 7 1
NAGPA N-acetylglucosamine-1-phosphodiester alpha-N-acetylglucosaminidase 16
LMNB1 lamin B1 5
ETV7 ETS variant transcription factor 7 6
THAP11 THAP domain containing 11 16
ARVCF ARVCF delta catenin family member 22
logFC AveExpr t P.Value adj.P.Val
GIPR 4.71 1.695 6.22 2.73e-07 0.00495
C4orf54 5.96 -1.023 5.59 1.80e-06 0.01356
EID2B -4.37 2.257 -5.37 3.32e-06 0.01356
SGCZ 5.06 2.941 5.37 3.38e-06 0.01356
CDC7 3.76 4.044 5.32 3.74e-06 0.01356
NAGPA -4.30 2.494 -5.13 6.69e-06 0.02023
LMNB1 3.70 3.825 5.07 7.88e-06 0.02043
ETV7 4.88 -0.327 4.81 1.73e-05 0.03934
THAP11 -3.90 1.640 -4.70 2.36e-05 0.04759
ARVCF 2.65 2.894 4.59 3.16e-05 0.05736Interaction of sex differences between DCM and Fetal
topTreat(treat.peri,coef=7)[,-c(1:3)] GENENAME CHR logFC AveExpr
GIPR gastric inhibitory polypeptide receptor 19 5.73 1.695
SGCZ sarcoglycan zeta 8 5.88 2.941
CLDN7 claudin 7 17 -7.51 -0.478
LMNB1 lamin B1 5 4.06 3.825
TIGD5 tigger transposable element derived 5 8 -5.30 1.992
SPATA33 spermatogenesis associated 33 16 -3.92 2.925
OR7D2 olfactory receptor family 7 subfamily D member 2 19 -4.51 -0.601
EID2B EP300 interacting inhibitor of differentiation 2B 19 -4.33 2.257
ETV7 ETS variant transcription factor 7 6 6.37 -0.327
GREM2 gremlin 2, DAN family BMP antagonist 1 5.20 0.913
t P.Value adj.P.Val
GIPR 5.69 1.30e-06 0.0237
SGCZ 4.84 1.62e-05 0.1149
CLDN7 -4.81 1.90e-05 0.1149
LMNB1 4.54 3.72e-05 0.1405
TIGD5 -4.54 3.87e-05 0.1405
SPATA33 -4.34 6.66e-05 0.2014
OR7D2 -4.15 1.19e-04 0.3003
EID2B -4.11 1.32e-04 0.3003
ETV7 4.01 1.93e-04 0.3236
GREM2 3.95 2.13e-04 0.3236Interaction of sex differences between ND and Fetal
topTreat(treat.peri,coef=8)[,-c(1:3)] GENENAME CHR logFC AveExpr t
NMUR2 neuromedin U receptor 2 5 4.79 -1.433 4.05
LINC00507 long intergenic non-protein coding RNA 507 12 -4.33 -1.558 -3.77
WFDC8 WAP four-disulfide core domain 8 20 4.36 -1.256 3.73
LINC01425 long intergenic non-protein coding RNA 1425 21 -3.92 -1.001 -3.45
ZNF304 zinc finger protein 304 19 3.89 2.288 3.29
ALB albumin 4 4.86 -1.191 3.26
CDC14C cell division cycle 14C 7 4.91 -1.334 3.20
MCCC1-AS1 MCCC1 antisense RNA 1 3 3.94 -1.428 3.17
LINC00589 long intergenic non-protein coding RNA 589 8 4.96 -0.389 3.15
PI4K2B phosphatidylinositol 4-kinase type 2 beta 4 5.13 1.018 3.15
P.Value adj.P.Val
NMUR2 0.000161 1
LINC00507 0.000349 1
WFDC8 0.000386 1
LINC01425 0.000839 1
ZNF304 0.001295 1
ALB 0.001465 1
CDC14C 0.001735 1
MCCC1-AS1 0.001784 1
LINC00589 0.001997 1
PI4K2B 0.002014 1Interaction of sex differences between DCM and ND
topTreat(treat.peri,coef=9)[,-c(1:3)] GENENAME
SLC22A14 solute carrier family 22 member 14
SLC44A2 solute carrier family 44 member 2
SLC12A2 solute carrier family 12 member 2
NAGPA N-acetylglucosamine-1-phosphodiester alpha-N-acetylglucosaminidase
ARVCF ARVCF delta catenin family member
CDC7 cell division cycle 7
HDAC11-AS1 HDAC11 antisense RNA 1
C4orf54 chromosome 4 open reading frame 54
CTXND2 cortexin domain containing 2
ZP1 zona pellucida glycoprotein 1
CHR logFC AveExpr t P.Value adj.P.Val
SLC22A14 3 -6.19 0.967 -4.68 2.62e-05 0.347
SLC44A2 19 2.49 6.223 4.53 3.82e-05 0.347
SLC12A2 5 -2.81 6.574 -4.01 1.66e-04 0.667
NAGPA 16 -5.03 2.494 -4.02 1.73e-04 0.667
ARVCF 22 4.14 2.894 3.99 1.84e-04 0.667
CDC7 1 5.27 4.044 3.85 2.90e-04 0.736
HDAC11-AS1 3 -5.27 0.135 -3.84 2.93e-04 0.736
C4orf54 4 6.30 -1.023 3.68 4.95e-04 0.736
CTXND2 1 -3.81 0.235 -3.60 5.53e-04 0.736
ZP1 11 -6.10 -1.182 -3.63 5.65e-04 0.736par(mar=c(5,5,3,2))
plot(treat.peri$coefficients[,1],treat.peri$coefficients[,2],xlab="logFC: ND vs Fetal", ylab="logFC: DCM vs Fetal",main="Pericytes",col=rgb(0,0,1,alpha=0.25),pch=16,cex=0.8)
abline(h=0,v=0,col=colours()[c(175)])
sig.genes <- dt.peri[,1] !=0 | dt.peri[,2] != 0
text(treat.peri$coefficients[sig.genes,1],treat.peri$coefficients[sig.genes,2],labels=rownames(dt.peri)[sig.genes],col=2,cex=0.6)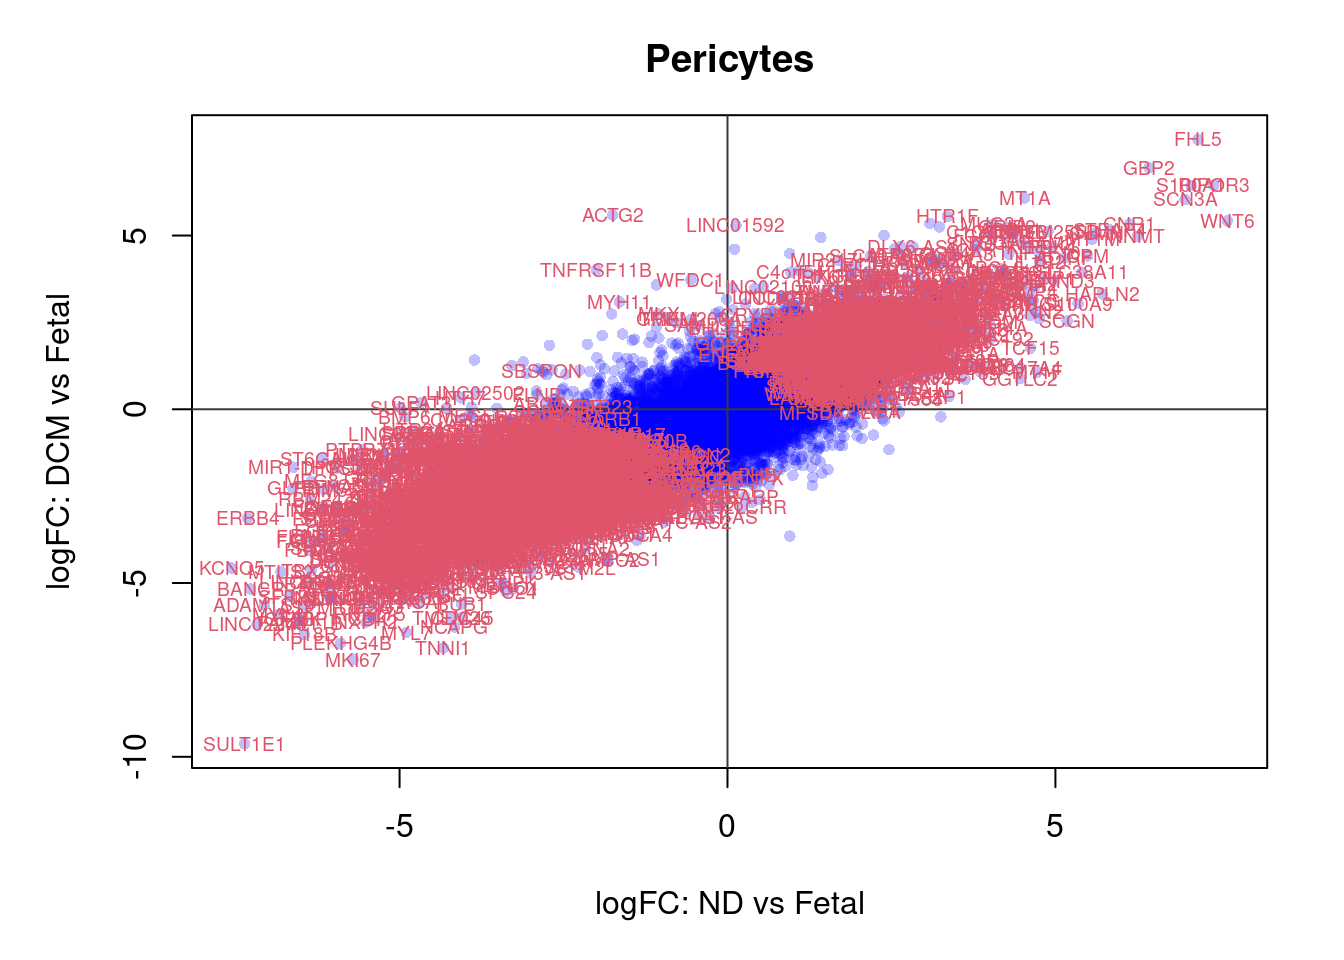
par(mar=c(5,5,3,2))
plot(treat.peri$coefficients[,4],treat.peri$coefficients[,5],xlab="logFC: Fetal Male vs Female", ylab="logFC: ND Male vs Female",main="Pericyte: Sex differences - Fetal and ND",col=rgb(0,0,1,alpha=0.25),pch=16,cex=0.8)
abline(h=0,v=0)
sig.genes <- dt.peri[,4] !=0 | dt.peri[,5] != 0
text(treat.peri$coefficients[sig.genes,4],treat.peri$coefficients[sig.genes,5],labels=rownames(dt.peri)[sig.genes],col=2,cex=0.6)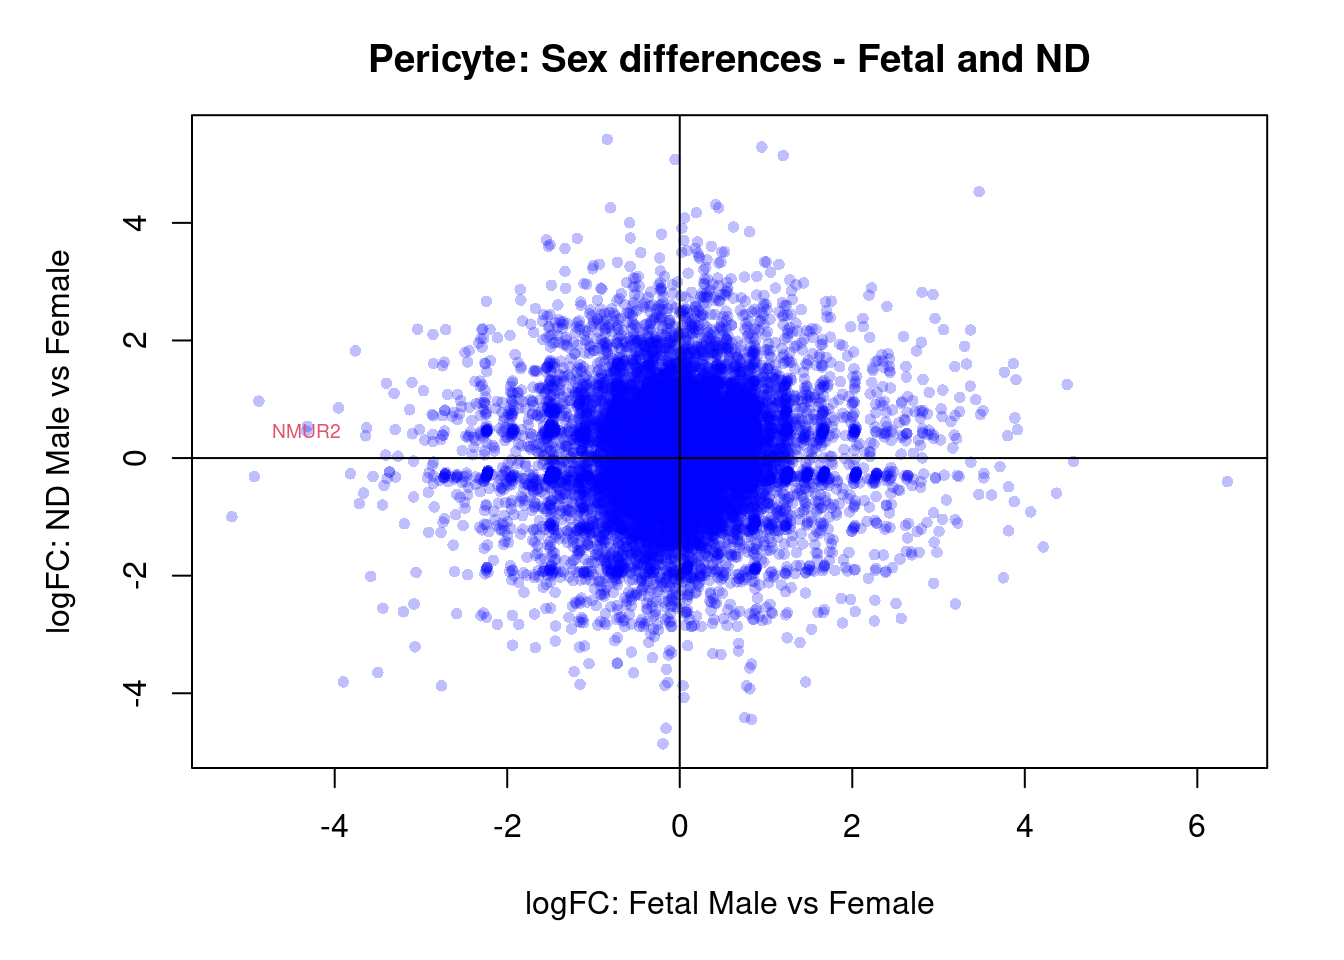
par(mar=c(5,5,3,2))
plot(treat.peri$coefficients[,4],treat.peri$coefficients[,6],xlab="logFC: Fetal Male vs Female", ylab="logFC: DCM Male vs Female",main="Pericyte: Sex differences - Fetal and DCM",col=rgb(0,0,1,alpha=0.25),pch=16,cex=0.8)
abline(h=0,v=0)
sig.genes <- dt.peri[,4] !=0 | dt.peri[,6] != 0
text(treat.peri$coefficients[sig.genes,4],treat.peri$coefficients[sig.genes,6],labels=rownames(dt.peri)[sig.genes],col=2,cex=0.6)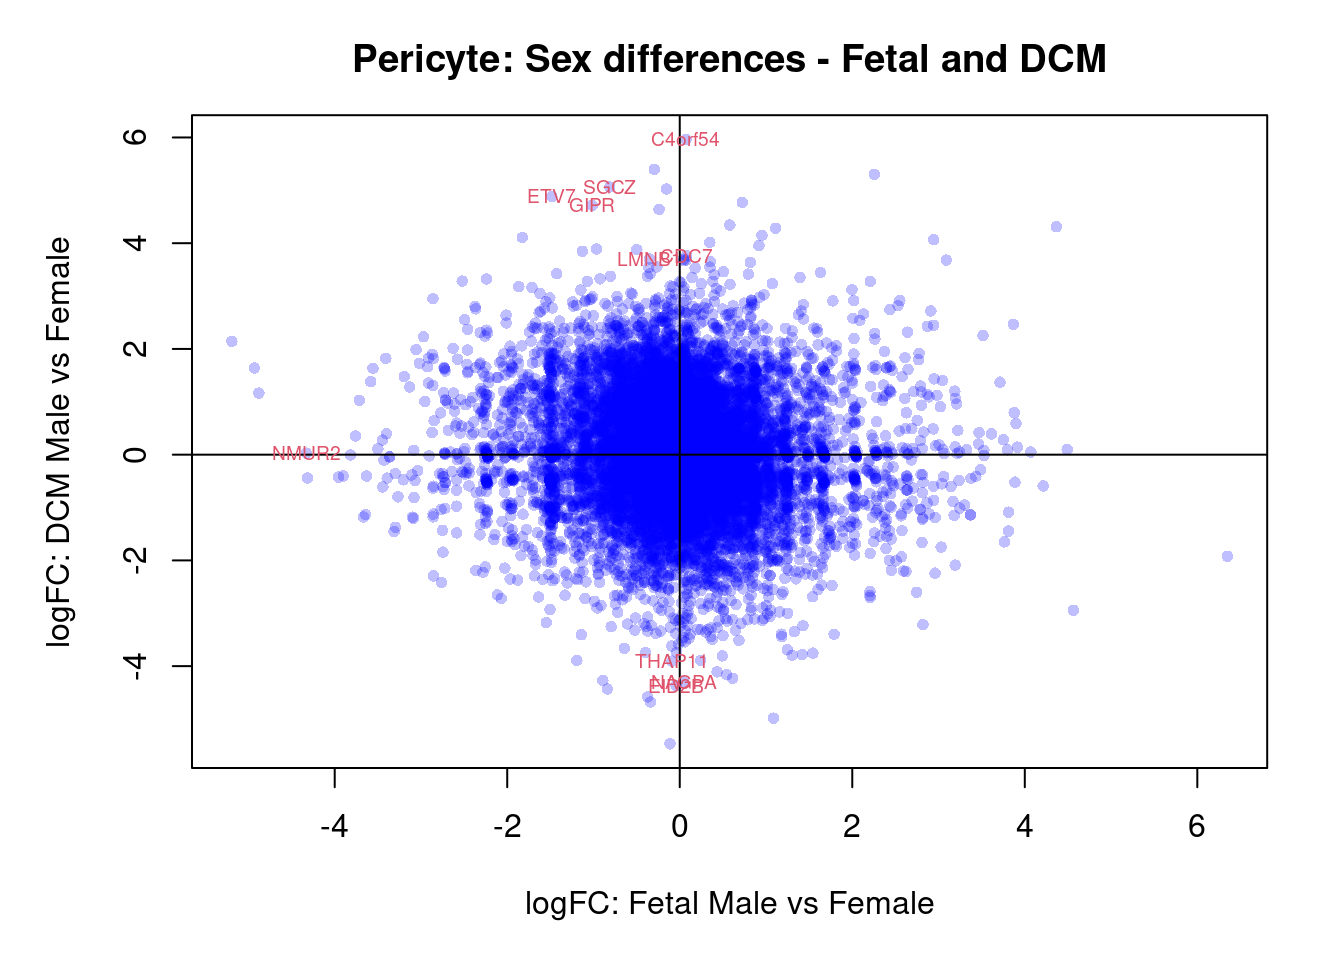
par(mar=c(5,5,3,2))
plot(treat.peri$coefficients[,5],treat.peri$coefficients[,6],xlab="logFC: ND Male vs Female", ylab="logFC: DCM Male vs Female",main="Pericyte: Sex differences - ND and DCM",col=rgb(0,0,1,alpha=0.25),pch=16,cex=0.8)
sig.genes <- dt.peri[,5] !=0 | dt.peri[,6] != 0
text(treat.peri$coefficients[sig.genes,5],treat.peri$coefficients[sig.genes,6],labels=rownames(dt.peri)[sig.genes],col=2,cex=0.6)
abline(h=0,v=0)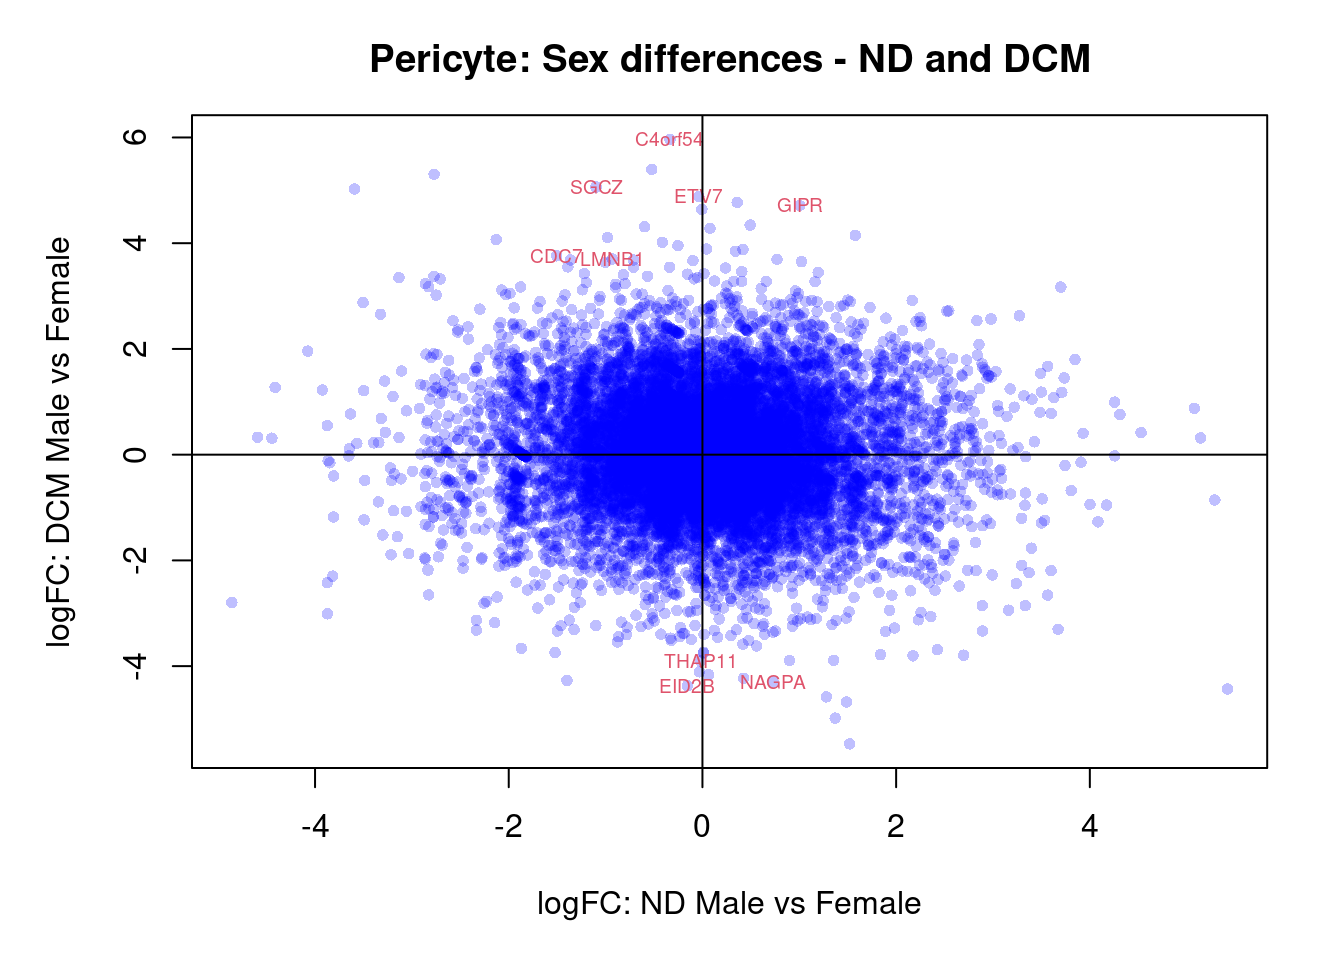
par(mar=c(5,5,3,2))
plot(treat.peri$coefficients[,4],treat.peri$coefficients[,5],xlab="logFC: Fetal Male vs Female", ylab="logFC: ND Male vs Female",main="Pericyte: Interaction term: Fetal vs ND",col=rgb(0,0,1,alpha=0.25),pch=16,cex=0.8)
abline(h=0,v=0)
sig.genes <- dt.peri[,8] !=0
if(sum(sig.genes)!=0){
  text(treat.peri$coefficients[sig.genes,4],treat.peri$coefficients[sig.genes,5],
       labels=rownames(dt.peri)[sig.genes],col=2,cex=0.6)
}
par(mar=c(5,5,3,2))
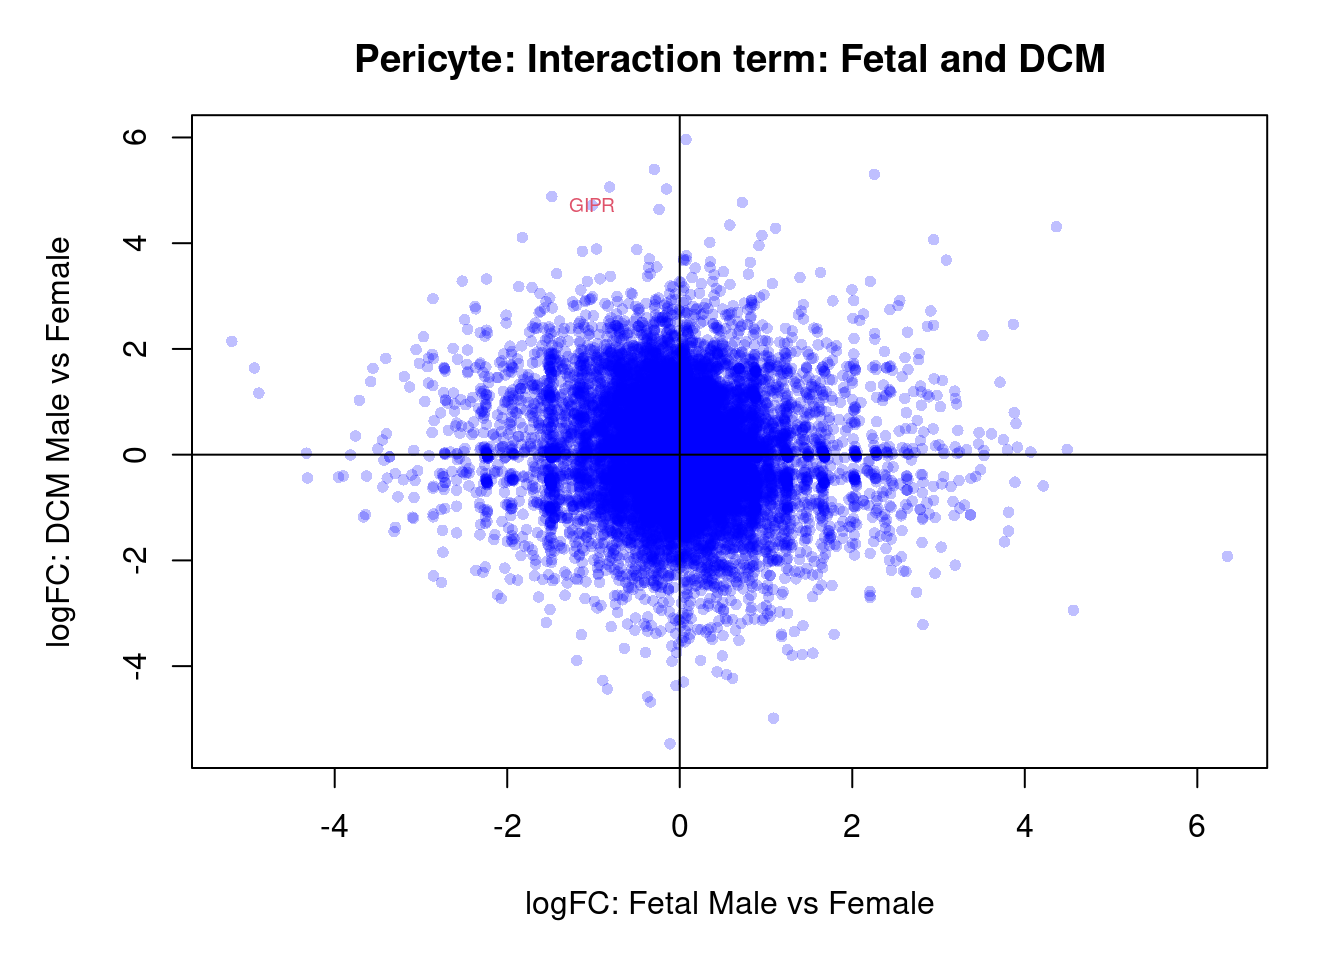
plot(treat.peri$coefficients[,4],treat.peri$coefficients[,6],xlab="logFC: Fetal Male vs Female", ylab="logFC: DCM Male vs Female",main="Pericyte: Interaction term: Fetal and DCM",col=rgb(0,0,1,alpha=0.25),pch=16,cex=0.8)
abline(h=0,v=0)
sig.genes <- dt.peri[,7] !=0
if(sum(sig.genes)!=0){
text(treat.peri$coefficients[sig.genes,4],treat.peri$coefficients[sig.genes,6],
labels=rownames(dt.peri)[sig.genes],col=2,cex=0.6)
}
par(mar=c(5,5,3,2))
plot(treat.peri$coefficients[,5],treat.peri$coefficients[,6],xlab="logFC: ND Male vs Female", ylab="logFC: DCM Male vs Female",main="Pericyte: Interaction term: ND and DCM",col=rgb(0,0,1,alpha=0.25),pch=16,cex=0.8)
abline(h=0,v=0)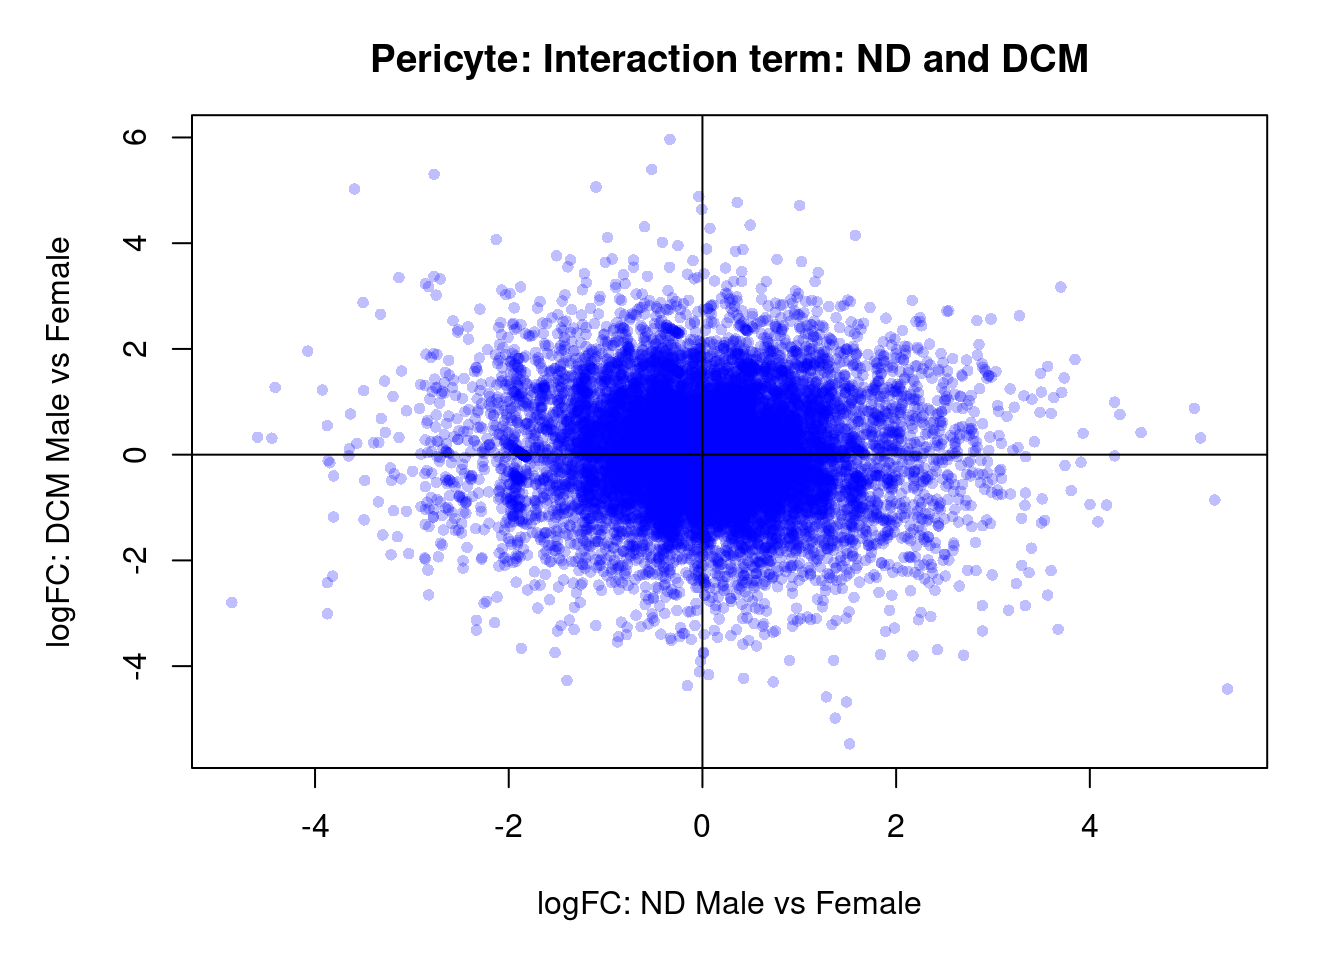
sig.genes <- dt.peri[,9] !=0
if(sum(sig.genes)!=0){
  text(treat.peri$coefficients[sig.genes,5],treat.peri$coefficients[sig.genes,6],
       labels=rownames(dt.peri)[sig.genes],col=2,cex=0.6)
}
Fibroblasts
cont.fibro <- makeContrasts(NvF = 0.5*(fibro.ND.Male + fibro.ND.Female) - 0.5*(fibro.Fetal.Male + fibro.Fetal.Female),
                         DvF = 0.5*(fibro.DCM.Male + fibro.DCM.Female) - 0.5*(fibro.Fetal.Male + fibro.Fetal.Female),
                         DvN = 0.5*(fibro.DCM.Male + fibro.DCM.Female) - 0.5*(fibro.ND.Male + fibro.ND.Female),
                         SexFetal = fibro.Fetal.Male - fibro.Fetal.Female,
                         SexND = fibro.ND.Male - fibro.ND.Female,
                         SexDCM = fibro.DCM.Male - fibro.DCM.Female,
                         InteractionDF = (fibro.DCM.Male - fibro.Fetal.Male) - (fibro.DCM.Female - fibro.Fetal.Female),
                         InteractionNF = (fibro.ND.Male - fibro.Fetal.Male) - (fibro.ND.Female - fibro.Fetal.Female),
                         InteractionDN = (fibro.DCM.Male - fibro.ND.Male) - (fibro.DCM.Female - fibro.ND.Female),
                         levels=design)
fit.fibro <- contrasts.fit(fit,contrasts = cont.fibro)
fit.fibro <- eBayes(fit.fibro,robust=TRUE)

summary(decideTests(fit.fibro))
NvF DvF DvN SexFetal SexND SexDCM InteractionDF InteractionNF
Down 1718 1955 470 10 0 303 10 0
NotSig 15148 14380 17031 18129 18141 17112 18095 18141
Up 1275 1806 640 2 0 726 36 0
InteractionDN
Down 90
NotSig 17849
Up 202treat.fibro <- treat(fit.fibro,lfc=0.5)
dt.fibro<-decideTests(treat.fibro)
summary(dt.fibro) NvF DvF DvN SexFetal SexND SexDCM InteractionDF InteractionNF
Down 717 711 33 3 0 33 1 0
NotSig 16918 16798 18057 18138 18141 17907 18129 18141
Up 506 632 51 0 0 201 11 0
InteractionDN
Down 9
NotSig 18081
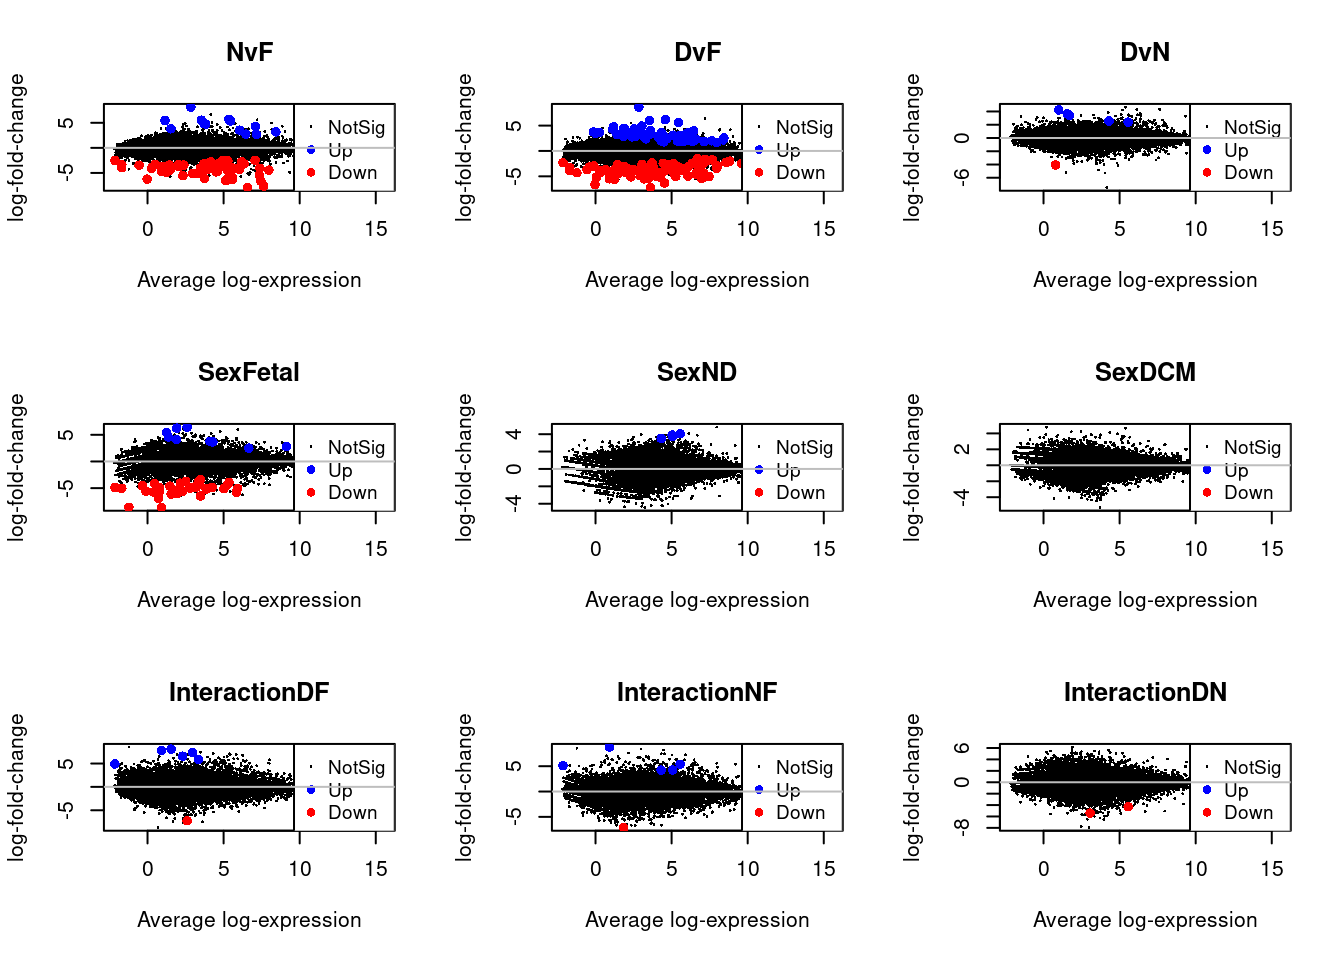
Up 51par(mfrow=c(3,3))
for(i in 1:9){
plotMD(treat.fibro,coef=i,status=dt.fibro[,i],hl.col=c("blue","red"))
abline(h=0,col="grey")
}
par(mfrow=c(1,1))
par(mar=c(7,4,2,2))
barplot(summary(dt.fibro)[-2,],beside=TRUE,legend=TRUE,col=c("blue","red"),ylab="Number of significant genes",las=2)
title("fibroblast cells")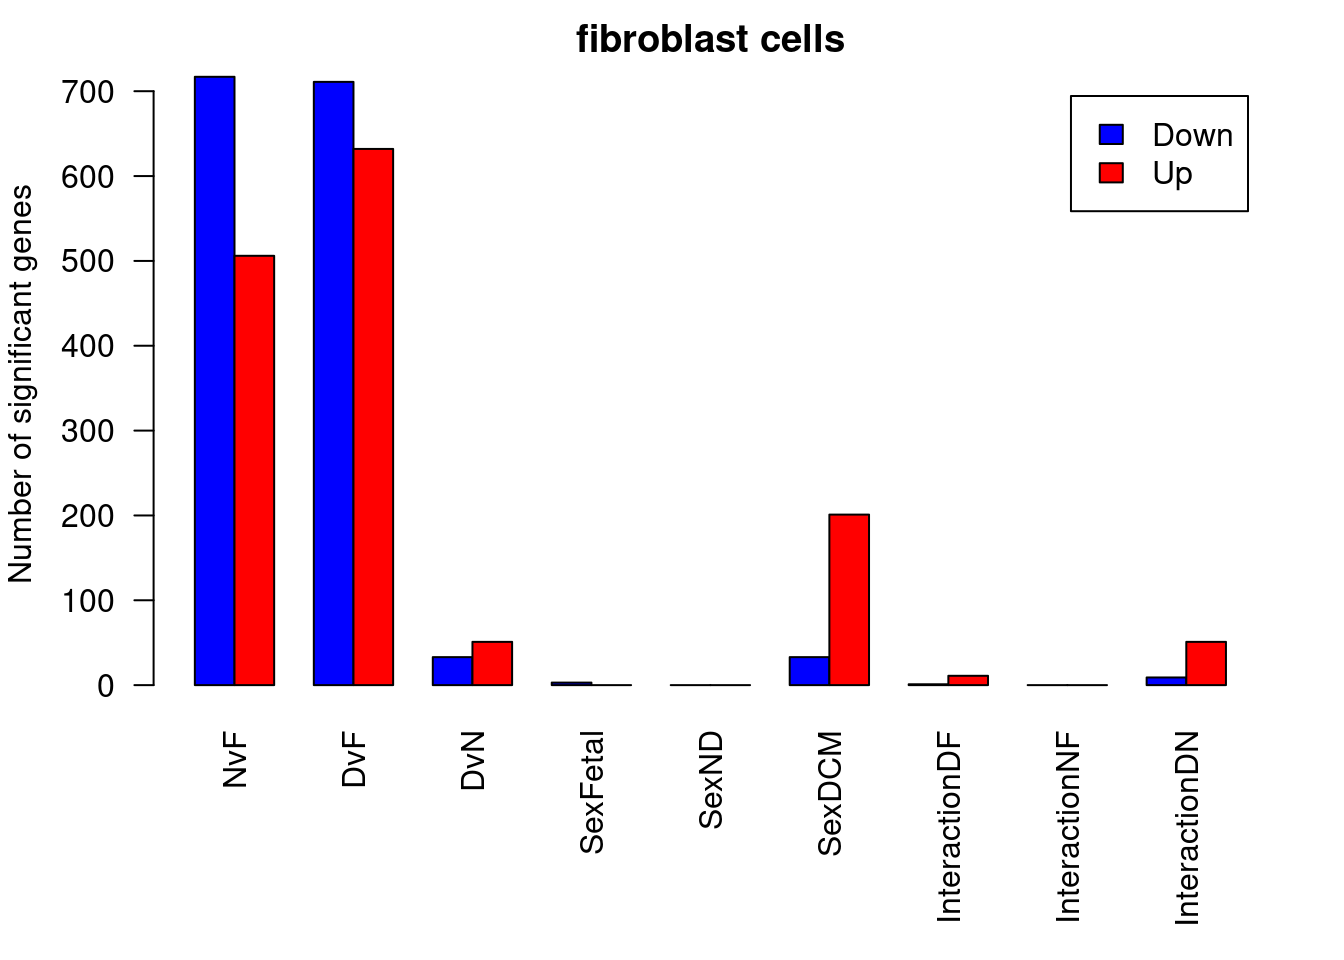
ND vs Fetal
options(digits=3)
topTreat(treat.fibro,coef=1,n=20,p.value=0.05)[,-c(1:3)]
GENENAME
IGF2BP3 insulin like growth factor 2 mRNA binding protein 3
CBLN4 cerebellin 4 precursor
MEST mesoderm specific transcript
SULT1E1 sulfotransferase family 1E member 1
ELFN2 extracellular leucine rich repeat and fibronectin type III domain containing 2
LAMA2 laminin subunit alpha 2
CNTNAP2 contactin associated protein 2
PRSS35 serine protease 35
ADAMTS19 ADAM metallopeptidase with thrombospondin type 1 motif 19
VIT vitrin
C11orf87 chromosome 11 open reading frame 87
CACNB4 calcium voltage-gated channel auxiliary subunit beta 4
DPP10 dipeptidyl peptidase like 10
MANCR mitotically associated long non coding RNA
ZNF385D-AS2 ZNF385D antisense RNA 2
ACSM3 acyl-CoA synthetase medium chain family member 3
PIEZO2 piezo type mechanosensitive ion channel component 2
TMEM26 transmembrane protein 26
PCDH8 protocadherin 8
TIMP4 TIMP metallopeptidase inhibitor 4
CHR logFC AveExpr t P.Value adj.P.Val
IGF2BP3 7 -5.84 4.2625 -13.43 4.17e-15 7.57e-11
CBLN4 20 -5.00 -1.9635 -12.81 1.53e-14 1.06e-10
MEST 7 -5.98 2.9025 -12.75 1.75e-14 1.06e-10
SULT1E1 4 -9.64 -0.0273 -12.50 3.14e-14 1.16e-10
ELFN2 22 -6.30 -0.3058 -12.46 3.27e-14 1.16e-10
LAMA2 6 3.88 10.9055 12.38 3.84e-14 1.16e-10
CNTNAP2 7 -3.50 6.4490 -12.14 6.46e-14 1.67e-10
PRSS35 6 -5.84 1.2339 -11.73 1.63e-13 3.69e-10
ADAMTS19 5 -3.68 4.5895 -11.38 3.61e-13 7.28e-10
VIT 2 5.03 2.6986 11.07 7.41e-13 1.34e-09
C11orf87 11 -5.71 -1.0511 -10.99 8.88e-13 1.44e-09
CACNB4 2 -3.79 4.4039 -10.96 9.55e-13 1.44e-09
DPP10 2 -4.40 3.9786 -10.62 2.16e-12 3.01e-09
MANCR 10 8.97 0.1508 10.53 2.76e-12 3.58e-09
ZNF385D-AS2 3 -6.47 -0.9359 -10.40 3.69e-12 4.46e-09
ACSM3 16 3.98 6.3303 10.13 6.98e-12 7.92e-09
PIEZO2 18 -4.72 4.5298 -9.99 9.82e-12 1.05e-08
TMEM26 10 -7.10 0.2725 -9.98 1.05e-11 1.05e-08
PCDH8 13 -4.57 -1.9855 -9.93 1.14e-11 1.05e-08
TIMP4 3 7.44 0.9791 9.94 1.16e-11 1.05e-08DCM vs Fetal
topTreat(treat.fibro,coef=2,n=20,p.value=0.05)[,-c(1:3)] GENENAME CHR logFC
PRSS35 serine protease 35 6 -6.99
IGF2BP3 insulin like growth factor 2 mRNA binding protein 3 7 -6.11
CNTNAP2 contactin associated protein 2 7 -3.65
C11orf87 chromosome 11 open reading frame 87 11 -6.58
MEST mesoderm specific transcript 7 -4.97
ADAMTS19 ADAM metallopeptidase with thrombospondin type 1 motif 19 5 -3.97
TMEM26 transmembrane protein 26 10 -8.06
DPP10-AS1 DPP10 antisense RNA 1 2 -5.79
DPP10 dipeptidyl peptidase like 10 2 -4.65
SULT1E1 sulfotransferase family 1E member 1 4 -8.25
ECHDC2 enoyl-CoA hydratase domain containing 2 1 2.65
ODF3B outer dense fiber of sperm tails 3B 22 7.80
GRID2 glutamate ionotropic receptor delta type subunit 2 4 -5.07
PIEZO2 piezo type mechanosensitive ion channel component 2 18 -4.61
HR HR lysine demethylase and nuclear receptor corepressor 8 6.54
PEG10 paternally expressed 10 7 -6.82
EPHA7 EPH receptor A7 6 -4.98
LINC02643 long intergenic non-protein coding RNA 2643 10 -5.87
SLC20A1 solute carrier family 20 member 1 2 3.82
HHIP hedgehog interacting protein 4 -4.78
AveExpr t P.Value adj.P.Val
PRSS35 1.2339 -14.27 7.78e-16 9.14e-12
IGF2BP3 4.2625 -14.13 1.01e-15 9.14e-12
CNTNAP2 6.4490 -13.26 5.89e-15 2.71e-11
C11orf87 -1.0511 -13.26 5.98e-15 2.71e-11
MEST 2.9025 -12.57 2.55e-14 9.25e-11
ADAMTS19 4.5895 -12.08 7.44e-14 2.25e-10
TMEM26 0.2725 -11.86 1.24e-13 3.22e-10
DPP10-AS1 -1.5080 -11.71 1.70e-13 3.85e-10
DPP10 3.9786 -11.16 5.92e-13 1.19e-09
SULT1E1 -0.0273 -10.88 1.20e-12 2.18e-09
ECHDC2 6.8983 10.55 2.51e-12 4.13e-09
ODF3B 1.9037 10.33 4.41e-12 6.16e-09
GRID2 5.2324 -10.32 4.41e-12 6.16e-09
PIEZO2 4.5298 -10.27 5.00e-12 6.48e-09
HR -0.0122 10.19 6.21e-12 7.14e-09
PEG10 1.1532 -10.18 6.30e-12 7.14e-09
EPHA7 5.2395 -9.86 1.37e-11 1.46e-08
LINC02643 0.3011 -9.83 1.50e-11 1.51e-08
SLC20A1 5.1735 9.78 1.65e-11 1.57e-08
HHIP 3.0760 -9.70 2.07e-11 1.87e-08DCM vs ND
topTreat(treat.fibro,coef=3,n=20,p.value=0.05)[,-c(1:3)] GENENAME CHR logFC AveExpr
EFCC1 EF-hand and coiled-coil domain containing 1 3 3.53 2.3116
ETHE1 ETHE1 persulfide dioxygenase 19 2.72 3.9160
BHLHE40-AS1 BHLHE40 antisense RNA 1 3 2.55 4.0588
SLC20A1 solute carrier family 20 member 1 2 2.41 5.1735
TRHDE thyrotropin releasing hormone degrading enzyme 12 -4.53 3.4862
CATSPER2 cation channel sperm associated 2 15 2.05 4.8723
LINC00968 long intergenic non-protein coding RNA 968 8 3.31 1.5733
ERI2 ERI1 exoribonuclease family member 2 16 -2.06 3.9203
ACSM3 acyl-CoA synthetase medium chain family member 3 16 -2.35 6.3303
HAS1 hyaluronan synthase 1 19 5.14 0.1473
LINC01139 long intergenic non-protein coding RNA 1139 1 3.81 -0.8969
ACSM1 acyl-CoA synthetase medium chain family member 1 16 -3.07 2.3530
C4orf54 chromosome 4 open reading frame 54 4 4.40 -1.0228
THUMPD1 THUMP domain containing 1 16 -1.88 5.0775
SWSAP1 SWIM-type zinc finger 7 associated protein 1 19 -3.21 1.2490
KAT2A lysine acetyltransferase 2A 17 1.66 3.7704
PTGFR prostaglandin F receptor 1 3.53 1.5067
WDR97 WD repeat domain 97 8 3.70 0.0832
MYPN myopalladin 10 4.53 5.1713
ATP6V0A1 ATPase H+ transporting V0 subunit a1 17 1.42 6.4971
t P.Value adj.P.Val
EFCC1 8.47 4.95e-10 8.98e-06
ETHE1 7.66 4.53e-09 4.11e-05
BHLHE40-AS1 7.50 7.01e-09 4.24e-05
SLC20A1 6.58 9.62e-08 4.36e-04
TRHDE -6.25 2.49e-07 7.15e-04
CATSPER2 6.21 2.76e-07 7.15e-04
LINC00968 6.19 2.97e-07 7.15e-04
ERI2 -6.17 3.15e-07 7.15e-04
ACSM3 -5.95 5.90e-07 1.19e-03
HAS1 5.75 1.08e-06 1.97e-03
LINC01139 5.59 1.69e-06 2.79e-03
ACSM1 -5.34 3.58e-06 5.41e-03
C4orf54 5.26 4.57e-06 6.12e-03
THUMPD1 -5.24 4.72e-06 6.12e-03
SWSAP1 -5.09 7.34e-06 8.05e-03
KAT2A 5.09 7.37e-06 8.05e-03
PTGFR 5.06 7.99e-06 8.05e-03
WDR97 5.06 8.06e-06 8.05e-03
MYPN 5.05 8.43e-06 8.05e-03
ATP6V0A1 4.93 1.18e-05 1.06e-02Male vs Female in Fetal samples
topTreat(treat.fibro,coef=4)[,-c(1:3)] GENENAME CHR logFC AveExpr t
NMUR2 neuromedin U receptor 2 5 -4.82 -1.433 -7.17
APOA2 apolipoprotein A2 1 -3.16 -2.107 -5.32
CLEC2A C-type lectin domain family 2 member A 12 -3.78 -1.971 -5.15
GREM1 gremlin 1, DAN family BMP antagonist 15 -4.86 -0.148 -4.87
CILP2 cartilage intermediate layer protein 2 19 -3.12 -0.869 -4.83
WIF1 WNT inhibitory factor 1 12 -4.76 -1.025 -4.77
LINC02117 long intergenic non-protein coding RNA 2117 5 3.10 -1.947 4.66
SFRP2 secreted frizzled related protein 2 4 -5.92 -1.226 -4.53
BTBD17 BTB domain containing 17 17 -4.06 -1.245 -4.42
SIX1 SIX homeobox 1 14 -3.32 -1.912 -4.37
P.Value adj.P.Val
NMUR2 1.81e-08 0.000328
APOA2 3.74e-06 0.033904
CLEC2A 6.20e-06 0.037463
GREM1 1.45e-05 0.057699
CILP2 1.59e-05 0.057699
WIF1 1.93e-05 0.058486
LINC02117 2.59e-05 0.067174
SFRP2 4.16e-05 0.094239
BTBD17 5.28e-05 0.106515
SIX1 6.02e-05 0.109152Male vs Female in ND samples
topTreat(treat.fibro,coef=5)[,-c(1:3)] GENENAME CHR logFC AveExpr
STC2 stanniocalcin 2 5 -4.11 0.968
UHRF1 ubiquitin like with PHD and ring finger domains 1 19 -3.01 2.115
LINC01442 long intergenic non-protein coding RNA 1442 13 -3.89 -1.458
PGC progastricsin 6 3.93 -1.292
LIPG lipase G, endothelial type 18 -4.22 0.677
LINC02549 long intergenic non-protein coding RNA 2549 6 3.57 -1.188
VIT vitrin 2 -1.74 2.699
RHD Rh blood group D antigen 1 5.79 3.222
SEMA3B-AS1 SEMA3B antisense RNA 1 (head to head) 3 3.68 -1.547
IGFBP1 insulin like growth factor binding protein 1 7 5.10 -2.033
t P.Value adj.P.Val
STC2 -4.49 4.28e-05 0.551
UHRF1 -4.34 6.64e-05 0.551
LINC01442 -4.23 9.10e-05 0.551
PGC 3.96 2.00e-04 0.907
LIPG -3.73 3.87e-04 1.000
LINC02549 3.64 4.85e-04 1.000
VIT -3.59 5.34e-04 1.000
RHD 3.63 5.58e-04 1.000
SEMA3B-AS1 3.58 5.81e-04 1.000
IGFBP1 3.59 5.96e-04 1.000Male vs Female in DCM samples
topTreat(treat.fibro,coef=6)[,-c(1:3)] GENENAME CHR logFC AveExpr
ETHE1 ETHE1 persulfide dioxygenase 19 4.10 3.916
LMNB1 lamin B1 5 5.75 3.825
C4orf54 chromosome 4 open reading frame 54 4 8.07 -1.023
DNAJC27 DnaJ heat shock protein family (Hsp40) member C27 2 3.34 4.847
SH3PXD2A SH3 and PX domains 2A 10 2.91 7.645
CDC7 cell division cycle 7 1 4.45 4.044
SLC20A1 solute carrier family 20 member 1 2 3.14 5.173
HAS1 hyaluronan synthase 1 19 4.99 0.147
SNHG9 small nucleolar RNA host gene 9 16 3.32 3.114
PLAU plasminogen activator, urokinase 10 4.98 2.466
t P.Value adj.P.Val
ETHE1 11.42 3.24e-13 5.87e-09
LMNB1 10.69 1.84e-12 1.66e-08
C4orf54 10.00 1.01e-11 6.13e-08
DNAJC27 9.22 6.97e-11 3.16e-07
SH3PXD2A 8.63 3.19e-10 1.16e-06
CDC7 7.93 2.16e-09 6.50e-06
SLC20A1 7.87 2.54e-09 6.50e-06
HAS1 7.83 2.87e-09 6.50e-06
SNHG9 7.37 1.01e-08 1.90e-05
PLAU 7.36 1.05e-08 1.90e-05Interaction of sex differences between DCM and Fetal
topTreat(treat.fibro,coef=7)[,-c(1:3)] GENENAME CHR logFC AveExpr
LMNB1 lamin B1 5 6.03 3.825
ETHE1 ETHE1 persulfide dioxygenase 19 4.28 3.916
SH3PXD2A SH3 and PX domains 2A 10 3.01 7.645
DNAJC27 DnaJ heat shock protein family (Hsp40) member C27 2 3.58 4.847
ADAMTSL2 ADAMTS like 2 9 5.65 3.116
CILP2 cartilage intermediate layer protein 2 19 4.42 -0.869
TAC1 tachykinin precursor 1 7 7.57 -1.043
CDC7 cell division cycle 7 1 4.11 4.044
PRRX2 paired related homeobox 2 9 3.83 2.458
LAMC1 laminin subunit gamma 1 1 -2.87 8.017
t P.Value adj.P.Val
LMNB1 6.93 3.57e-08 0.000648
ETHE1 6.33 1.99e-07 0.001803
SH3PXD2A 5.96 5.74e-07 0.003469
DNAJC27 5.60 1.67e-06 0.007581
ADAMTSL2 5.28 4.47e-06 0.016195
CILP2 5.19 5.63e-06 0.016195
TAC1 5.18 6.25e-06 0.016195
CDC7 5.07 7.97e-06 0.018081
PRRX2 4.85 1.50e-05 0.027830
LAMC1 -4.83 1.59e-05 0.027830Interaction of sex differences between ND and Fetal
topTreat(treat.fibro,coef=8)[,-c(1:3)] GENENAME CHR logFC AveExpr t
CLEC2A C-type lectin domain family 2 member A 12 5.29 -1.971 4.66
BTBD17 BTB domain containing 17 17 6.19 -1.245 4.57
LINC01139 long intergenic non-protein coding RNA 1139 1 5.31 -0.897 4.40
CHST4 carbohydrate sulfotransferase 4 16 5.91 -0.773 4.04
APOA2 apolipoprotein A2 1 3.32 -2.107 3.79
NMUR2 neuromedin U receptor 2 5 4.53 -1.433 3.80
LINC01781 long intergenic non-protein coding RNA 1781 1 5.43 -1.215 3.72
GLIS1 GLIS family zinc finger 1 1 4.07 2.260 3.69
WIF1 WNT inhibitory factor 1 12 5.80 -1.025 3.71
LINC01799 long intergenic non-protein coding RNA 1799 2 5.87 -1.183 3.67
P.Value adj.P.Val
CLEC2A 2.77e-05 0.335
BTBD17 3.70e-05 0.335
LINC01139 5.79e-05 0.350
CHST4 1.71e-04 0.776
APOA2 3.12e-04 0.878
NMUR2 3.23e-04 0.878
LINC01781 4.25e-04 0.878
GLIS1 4.36e-04 0.878
WIF1 4.40e-04 0.878
LINC01799 4.89e-04 0.878Interaction of sex differences between DCM and ND
topTreat(treat.fibro,coef=9)[,-c(1:3)] GENENAME CHR logFC AveExpr
LMNB1 lamin B1 5 6.85 3.83
ETHE1 ETHE1 persulfide dioxygenase 19 4.84 3.92
SH3PXD2A SH3 and PX domains 2A 10 3.65 7.65
TNC tenascin C 9 7.02 4.13
DNMT1 DNA methyltransferase 1 19 2.89 5.69
DNAJC27 DnaJ heat shock protein family (Hsp40) member C27 2 3.27 4.85
SLC20A1 solute carrier family 20 member 1 2 3.63 5.17
PGC progastricsin 6 -6.96 -1.29
CDC7 cell division cycle 7 1 4.89 4.04
ADAMTSL2 ADAMTS like 2 9 4.89 3.12
t P.Value adj.P.Val
LMNB1 8.52 4.50e-10 8.17e-06
ETHE1 7.49 7.35e-09 6.67e-05
SH3PXD2A 7.20 1.62e-08 9.79e-05
TNC 6.20 3.08e-07 1.40e-03
DNMT1 5.69 1.26e-06 4.57e-03
DNAJC27 5.45 2.57e-06 7.29e-03
SLC20A1 5.40 3.01e-06 7.29e-03
PGC -5.40 3.22e-06 7.29e-03
CDC7 5.33 3.71e-06 7.47e-03
ADAMTSL2 5.20 5.55e-06 9.42e-03par(mar=c(5,5,3,2))
plot(treat.fibro$coefficients[,1],treat.fibro$coefficients[,2],xlab="logFC: ND vs Fetal", ylab="logFC: DCM vs Fetal",main="Fibroblasts",col=rgb(0,0,1,alpha=0.25),pch=16,cex=0.8)
abline(h=0,v=0,col=colours()[c(175)])
sig.genes <- dt.fibro[,1] !=0 | dt.fibro[,2] != 0
text(treat.fibro$coefficients[sig.genes,1],treat.fibro$coefficients[sig.genes,2],labels=rownames(dt.fibro)[sig.genes],col=2,cex=0.6)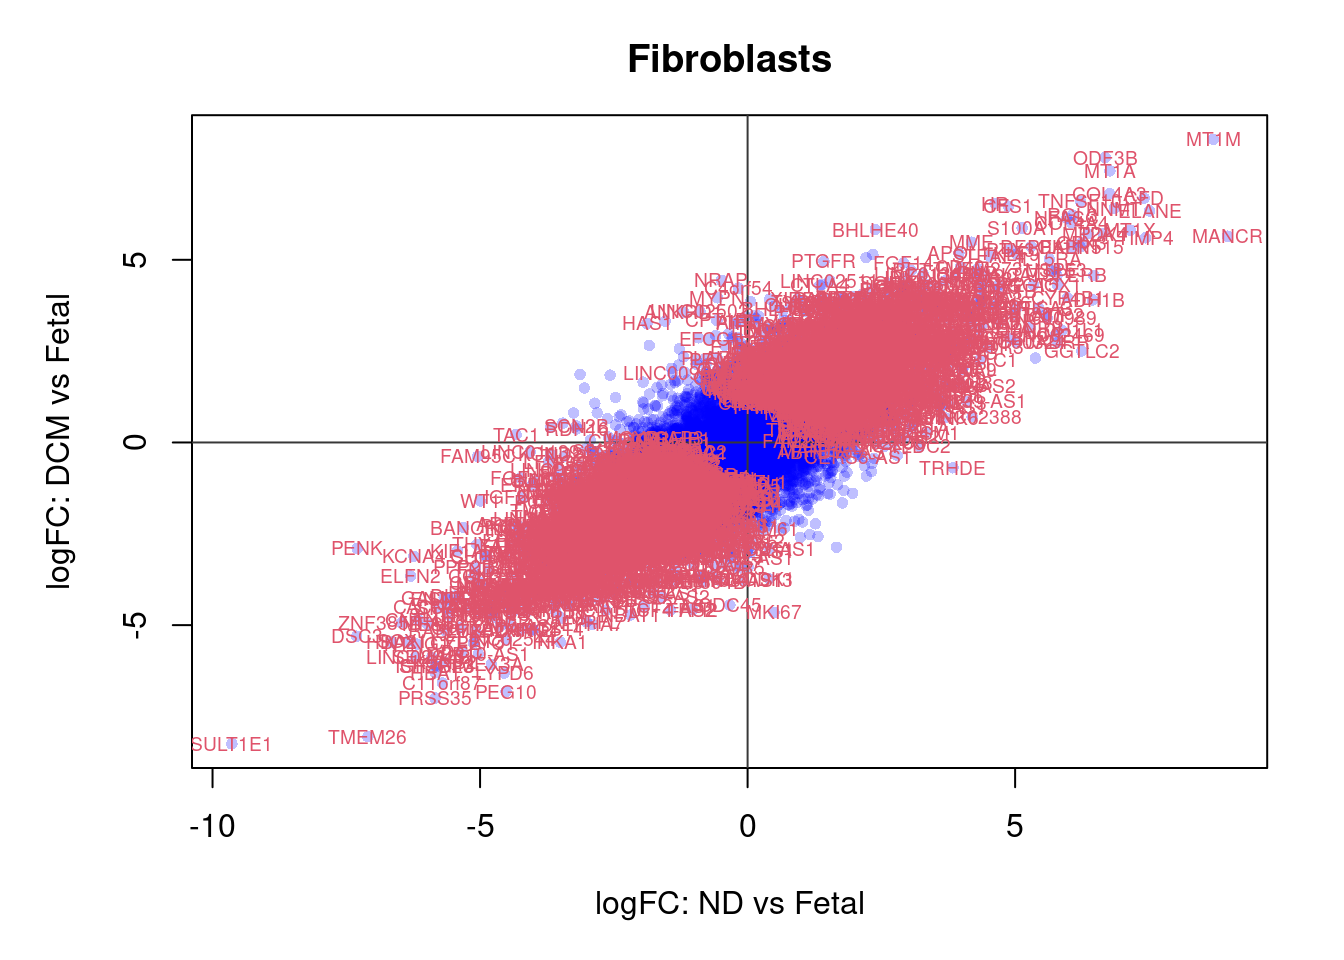
par(mar=c(5,5,3,2))
plot(treat.fibro$coefficients[,4],treat.fibro$coefficients[,5],xlab="logFC: Fetal Male vs Female", ylab="logFC: ND Male vs Female",main="Fibroblasts: Sex differences - Fetal and ND",col=rgb(0,0,1,alpha=0.25),pch=16,cex=0.8)
abline(h=0,v=0)
sig.genes <- dt.fibro[,4] !=0 | dt.fibro[,5] != 0
text(treat.fibro$coefficients[sig.genes,4],treat.fibro$coefficients[sig.genes,5],labels=rownames(dt.fibro)[sig.genes],col=2,cex=0.6)
par(mar=c(5,5,3,2))
plot(treat.fibro$coefficients[,4],treat.fibro$coefficients[,6],xlab="logFC: Fetal Male vs Female", ylab="logFC: DCM Male vs Female",main="Fibroblasts: Sex differences - Fetal and DCM",col=rgb(0,0,1,alpha=0.25),pch=16,cex=0.8)
abline(h=0,v=0)
sig.genes <- dt.fibro[,4] !=0 | dt.fibro[,6] != 0
text(treat.fibro$coefficients[sig.genes,4],treat.fibro$coefficients[sig.genes,6],labels=rownames(dt.fibro)[sig.genes],col=2,cex=0.6)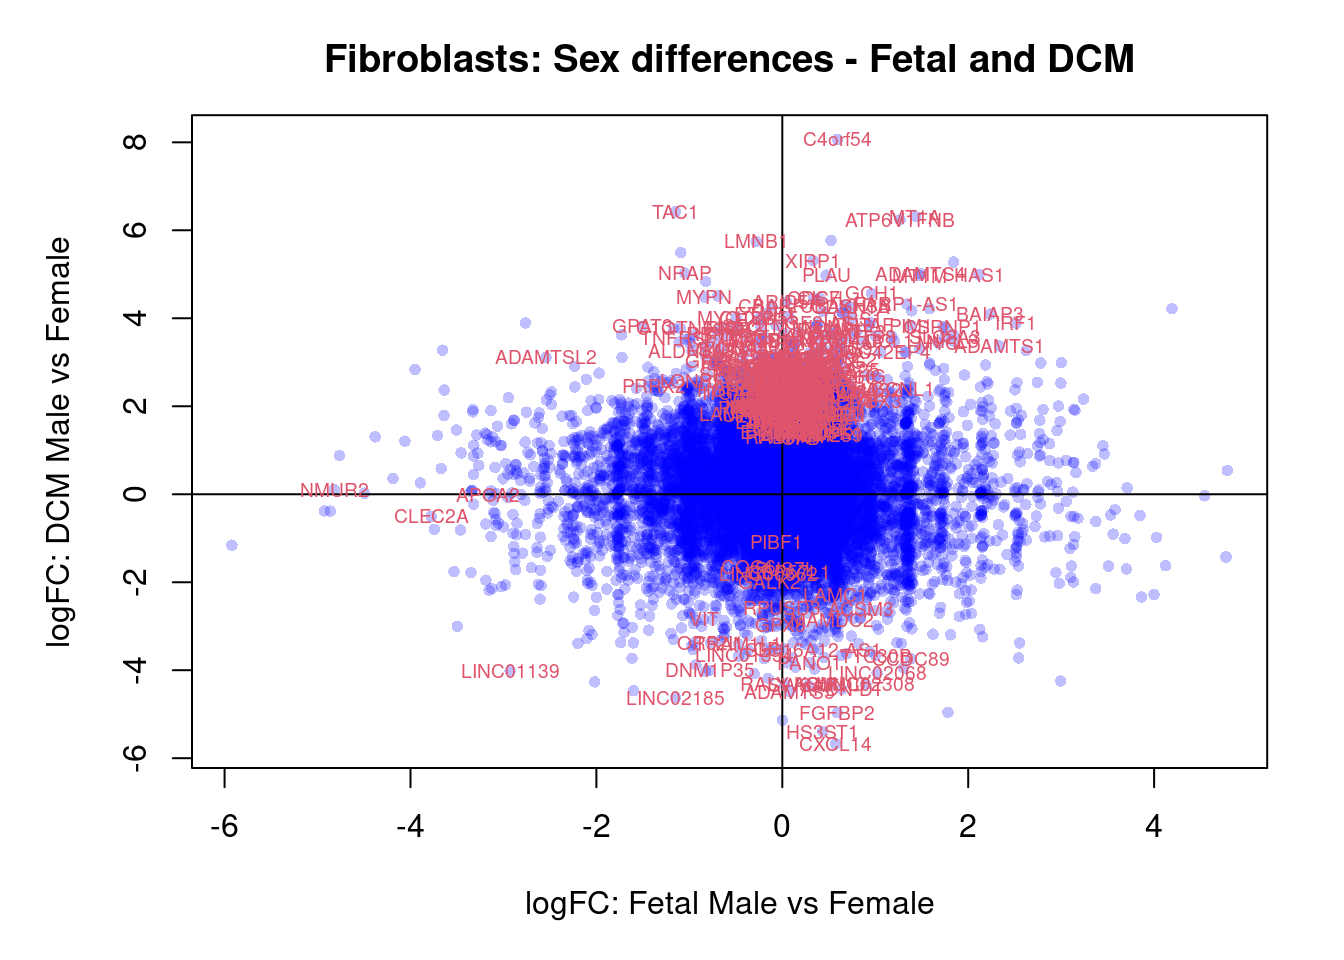
par(mar=c(5,5,3,2))
plot(treat.fibro$coefficients[,5],treat.fibro$coefficients[,6],xlab="logFC: ND Male vs Female", ylab="logFC: DCM Male vs Female",main="Fibroblasts: Sex differences - ND and DCM",col=rgb(0,0,1,alpha=0.25),pch=16,cex=0.8)
sig.genes <- dt.fibro[,5] !=0 | dt.fibro[,6] != 0
text(treat.fibro$coefficients[sig.genes,5],treat.fibro$coefficients[sig.genes,6],labels=rownames(dt.fibro)[sig.genes],col=2,cex=0.6)
abline(h=0,v=0)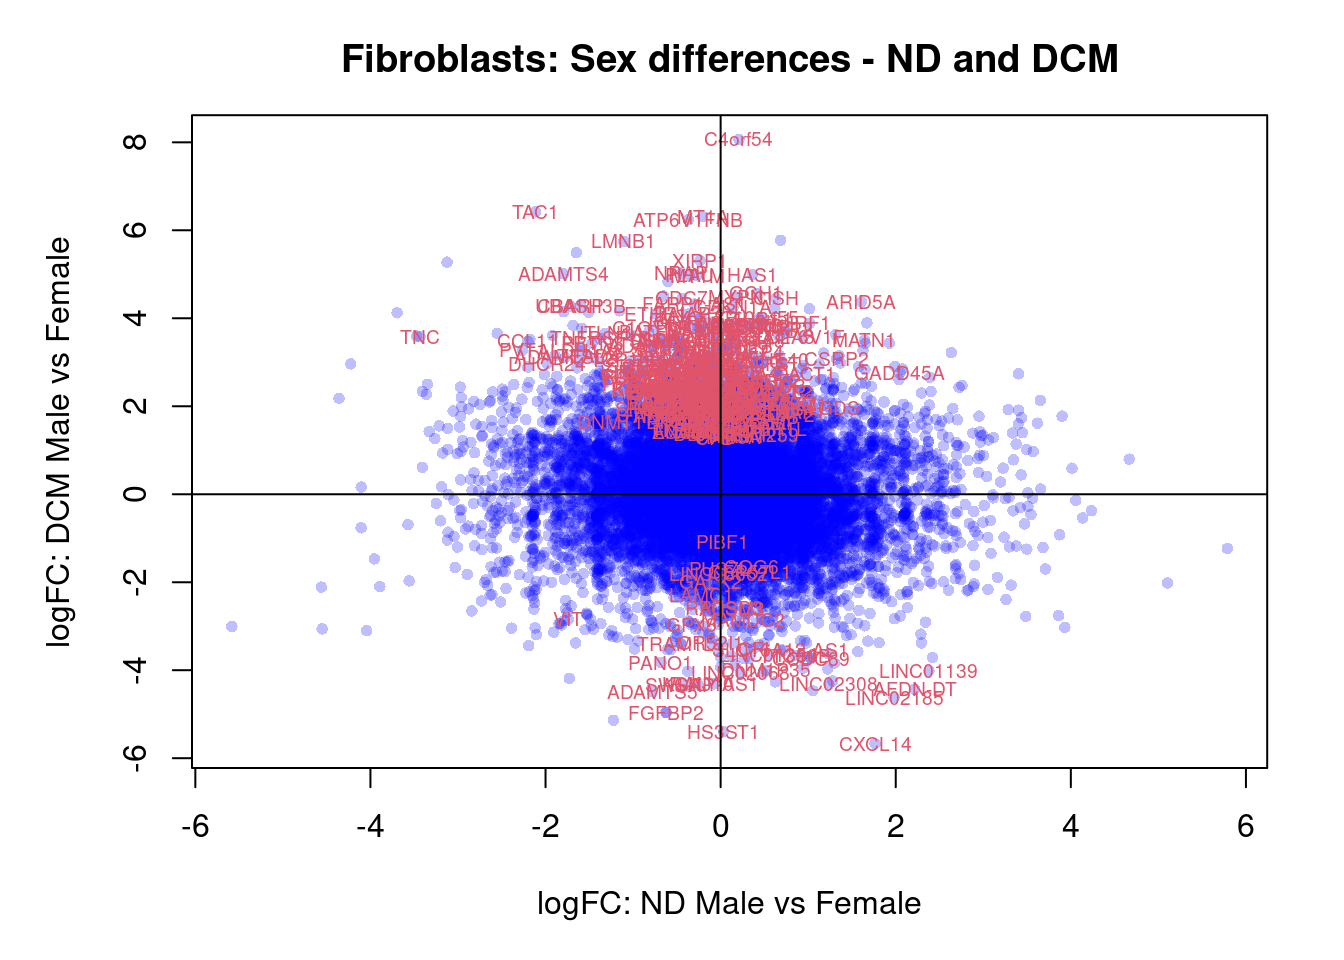
par(mar=c(5,5,3,2))
plot(treat.fibro$coefficients[,4],treat.fibro$coefficients[,5],xlab="logFC: Fetal Male vs Female", ylab="logFC: ND Male vs Female",main="Fibroblasts: Interaction term: Fetal vs ND",col=rgb(0,0,1,alpha=0.25),pch=16,cex=0.8)
abline(h=0,v=0)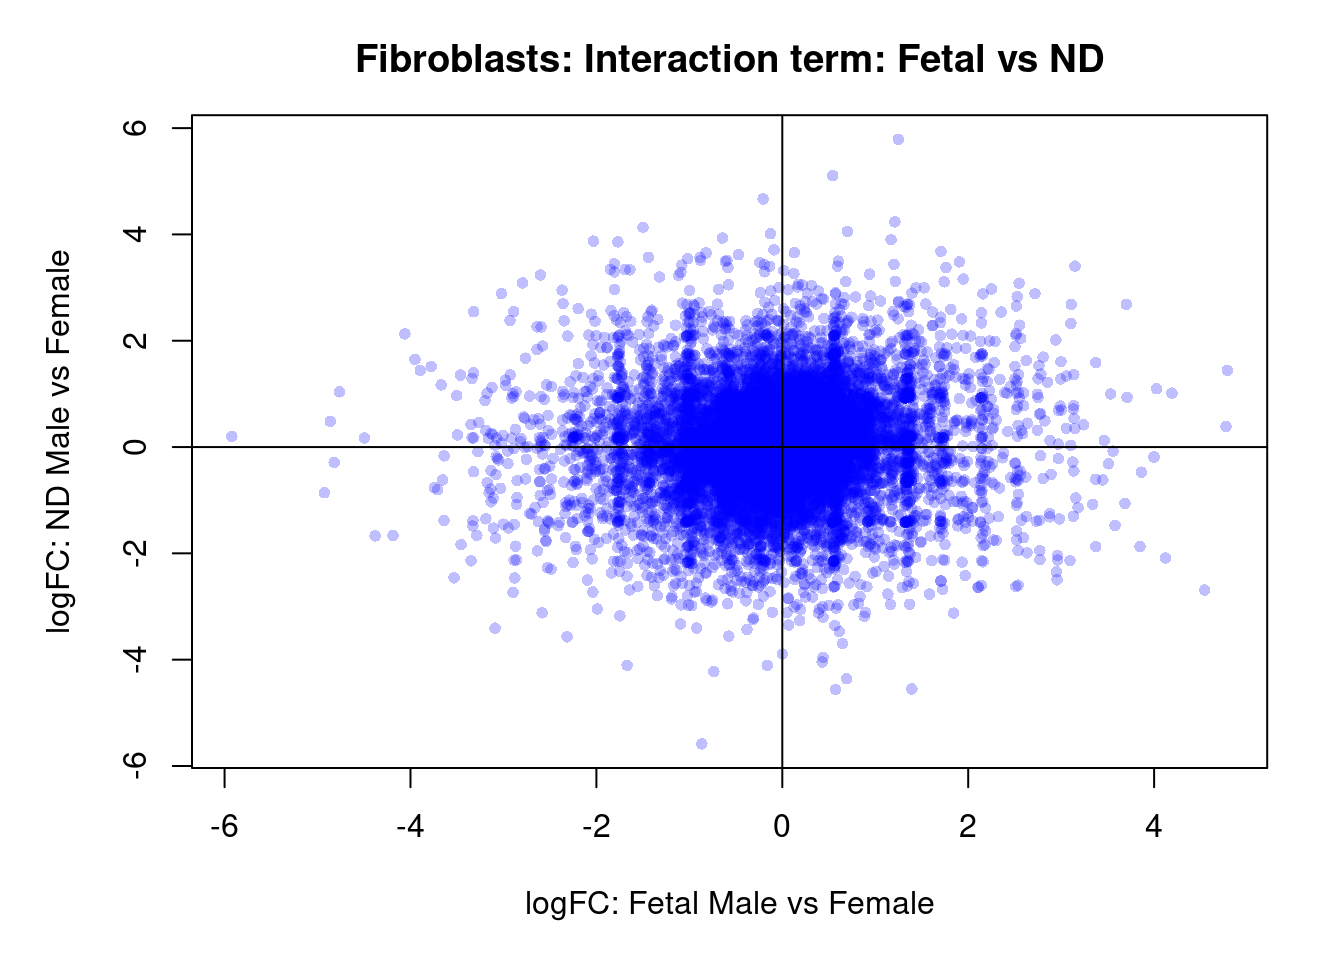
sig.genes <- dt.fibro[,8] !=0
if(sum(sig.genes)!=0){
  text(treat.fibro$coefficients[sig.genes,4],treat.fibro$coefficients[sig.genes,5],
       labels=rownames(dt.fibro)[sig.genes],col=2,cex=0.6)
}
par(mar=c(5,5,3,2))
plot(treat.fibro$coefficients[,4],treat.fibro$coefficients[,6],xlab="logFC: Fetal Male vs Female", ylab="logFC: DCM Male vs Female",main="Fibroblast: Interaction term: Fetal and DCM",col=rgb(0,0,1,alpha=0.25),pch=16,cex=0.8)
abline(h=0,v=0)
sig.genes <- dt.fibro[,7] !=0
text(treat.fibro$coefficients[sig.genes,4],treat.fibro$coefficients[sig.genes,6],labels=rownames(dt.fibro)[sig.genes],col=2,cex=0.6)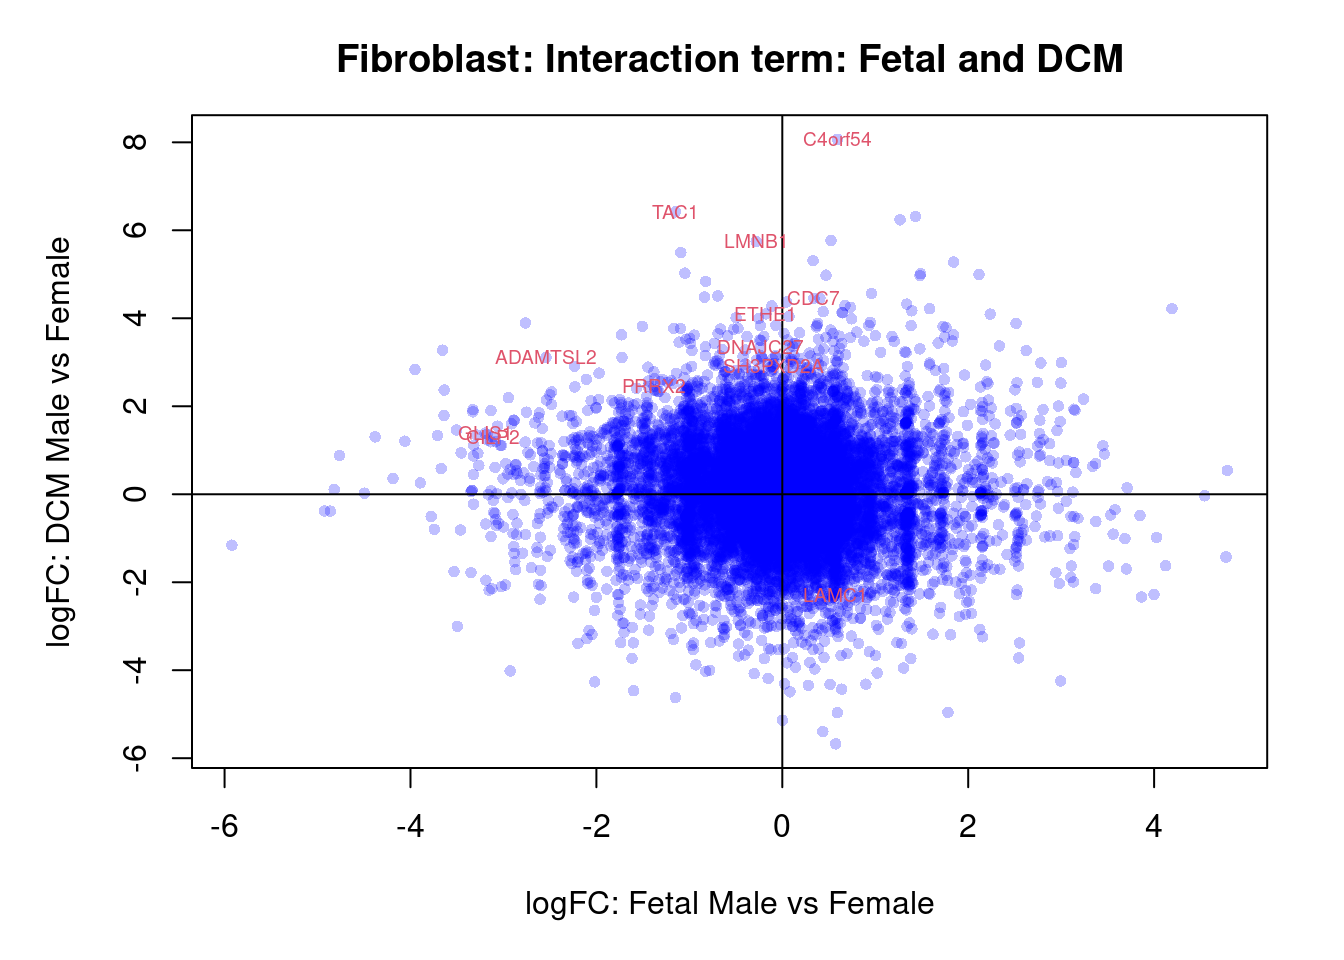
par(mar=c(5,5,3,2))
plot(treat.fibro$coefficients[,5],treat.fibro$coefficients[,6],xlab="logFC: ND Male vs Female", ylab="logFC: DCM Male vs Female",main="Fibroblasts: Interaction term: ND and DCM",col=rgb(0,0,1,alpha=0.25),pch=16,cex=0.8)
abline(h=0,v=0)
sig.genes <- dt.fibro[,9] !=0
text(treat.fibro$coefficients[sig.genes,5],treat.fibro$coefficients[sig.genes,6],labels=rownames(dt.fibro)[sig.genes],col=2,cex=0.6)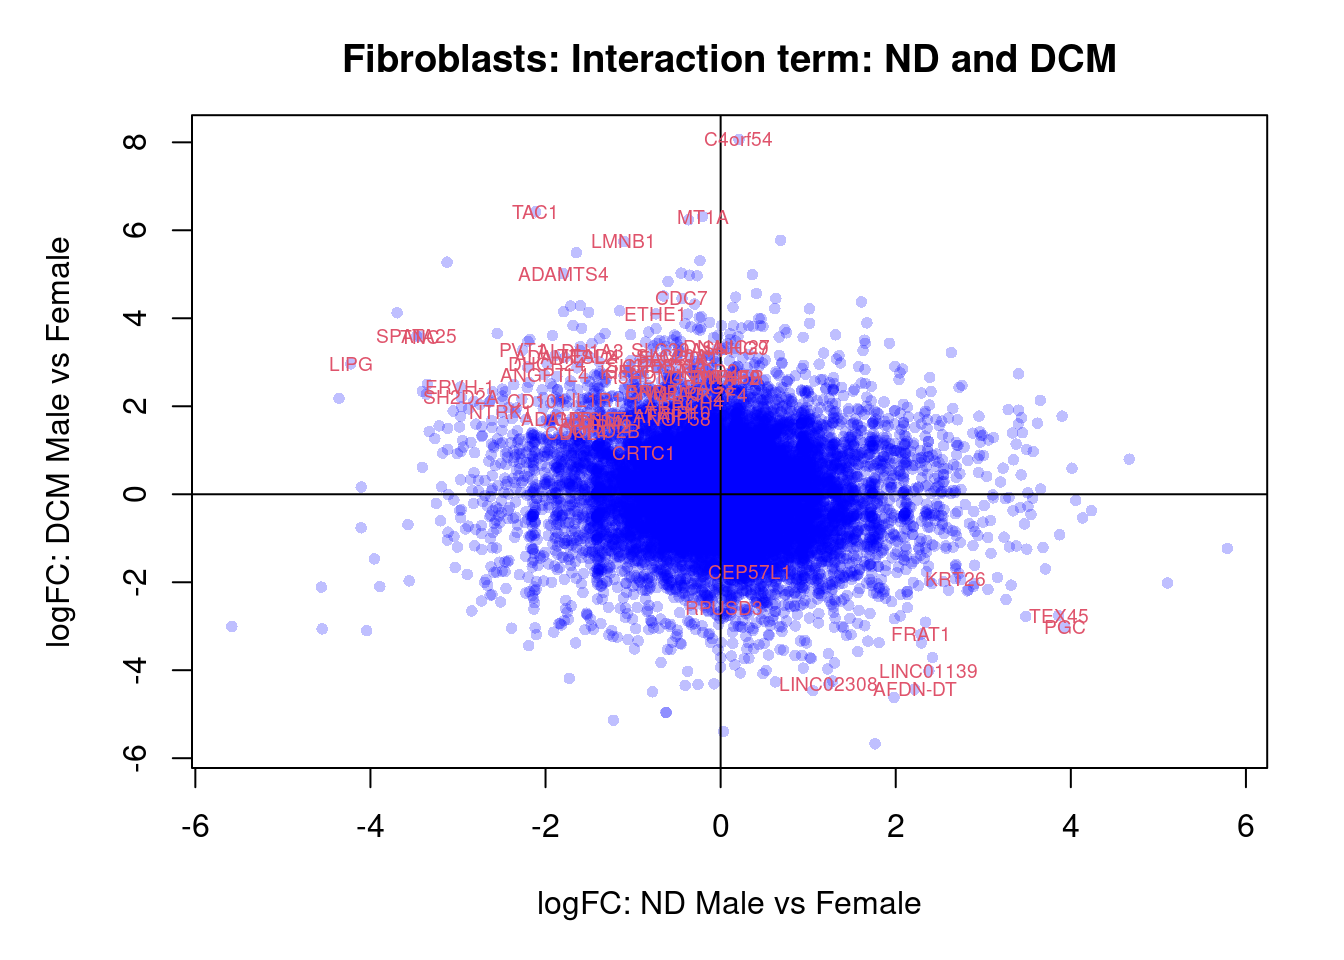
Smooth muscle cells
cont.smc <- makeContrasts(NvF = 0.5*(smc.ND.Male + smc.ND.Female) - 0.5*(smc.Fetal.Male + smc.Fetal.Female),
                         DvF = 0.5*(smc.DCM.Male + smc.DCM.Female) - 0.5*(smc.Fetal.Male + smc.Fetal.Female),
                         DvN = 0.5*(smc.DCM.Male + smc.DCM.Female) - 0.5*(smc.ND.Male + smc.ND.Female),
                         SexFetal = smc.Fetal.Male - smc.Fetal.Female,
                         SexND = smc.ND.Male - smc.ND.Female,
                         SexDCM = smc.DCM.Male - smc.DCM.Female,
                         InteractionDF = (smc.DCM.Male - smc.Fetal.Male) - (smc.DCM.Female - smc.Fetal.Female),
                         InteractionNF = (smc.ND.Male - smc.Fetal.Male) - (smc.ND.Female - smc.Fetal.Female),
                         InteractionDN = (smc.DCM.Male - smc.ND.Male) - (smc.DCM.Female - smc.ND.Female),
                         levels=design)
fit.smc <- contrasts.fit(fit,contrasts = cont.smc)
fit.smc <- eBayes(fit.smc,robust=TRUE)

summary(decideTests(fit.smc))
NvF DvF DvN SexFetal SexND SexDCM InteractionDF InteractionNF
Down 144 342 4 68 1 2 3 1
NotSig 17926 17500 18124 18041 18132 18139 18132 18132
Up 71 299 13 32 8 0 6 8
InteractionDN
Down 3
NotSig 18138
Up 0treat.smc <- treat(fit.smc,lfc=0.5)
dt.smc<-decideTests(treat.smc)
summary(dt.smc) NvF DvF DvN SexFetal SexND SexDCM InteractionDF InteractionNF
Down 53 104 1 35 0 0 1 1
NotSig 18075 17979 18135 18097 18137 18141 18134 18135
Up 13 58 5 9 4 0 6 5
InteractionDN
Down 2
NotSig 18139
Up 0par(mfrow=c(3,3))
for(i in 1:9){
plotMD(treat.smc,coef=i,status=dt.smc[,i],hl.col=c("blue","red"))
abline(h=0,col="grey")
}
par(mfrow=c(1,1))
par(mar=c(7,4,2,2))
barplot(summary(dt.smc)[-2,],beside=TRUE,legend=TRUE,col=c("blue","red"),ylab="Number of significant genes",las=2)
title("smooth muscle cells")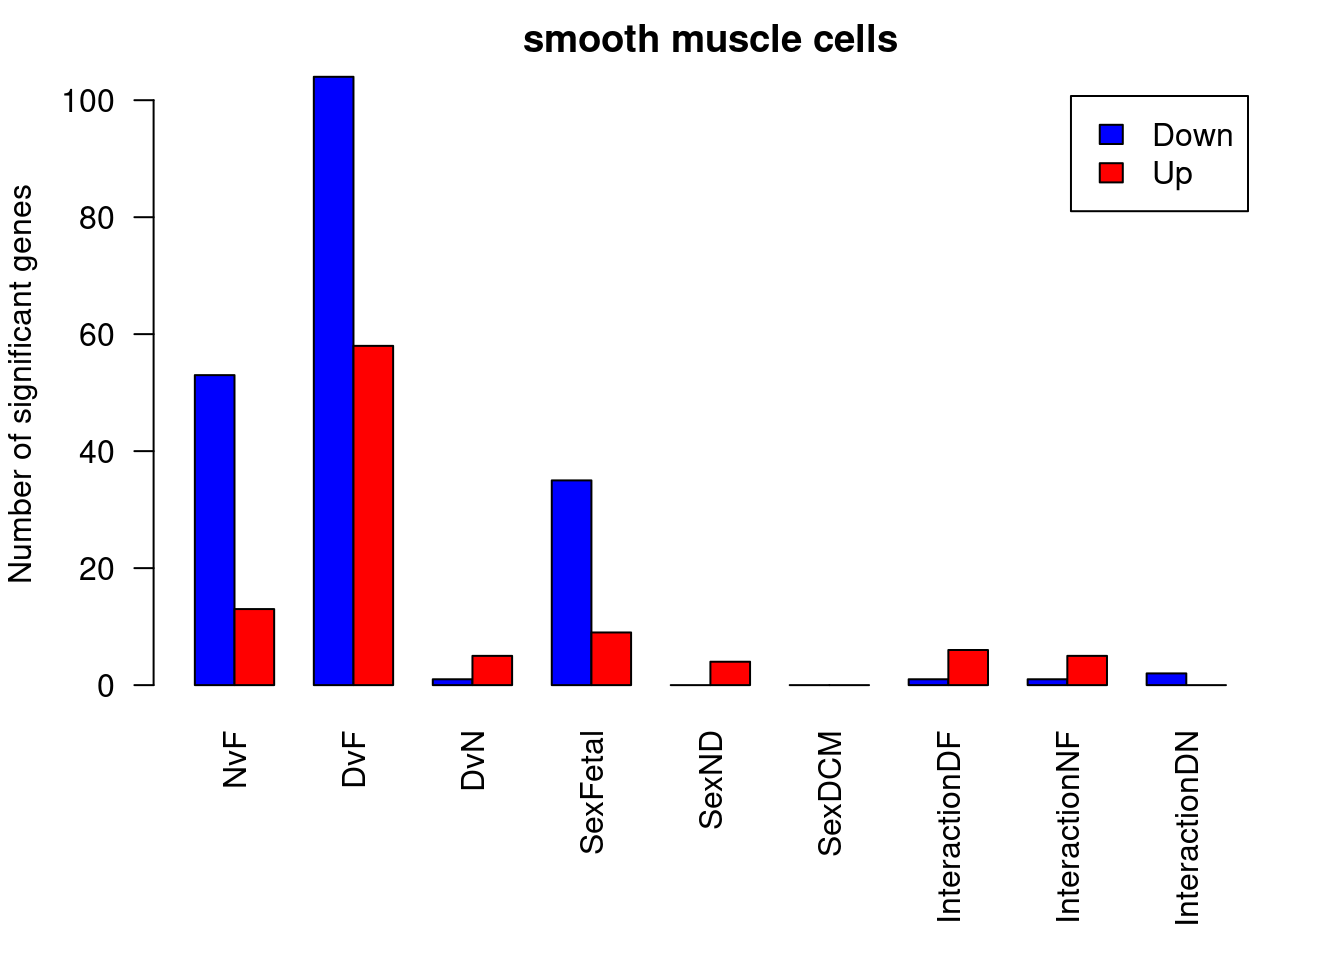
ND vs Fetal
options(digits=3)
topTreat(treat.smc,coef=1,n=20,p.value=0.05)[,-c(1:3)]
GENENAME CHR logFC
SCN3A sodium voltage-gated channel alpha subunit 3 2 8.13
PRSS35 serine protease 35 6 -4.88
GREM2 gremlin 2, DAN family BMP antagonist 1 -4.72
SULT1E1 sulfotransferase family 1E member 1 4 -6.24
MEG3 maternally expressed 3 14 -6.56
CBFA2T3 CBFA2/RUNX1 partner transcriptional co-repressor 3 16 5.53
IGF2BP3 insulin like growth factor 2 mRNA binding protein 3 7 -4.18
PRDM6 PR/SET domain 6 5 -4.86
TOX thymocyte selection associated high mobility group box 8 -5.65
ZNF730 zinc finger protein 730 19 -3.18
PIEZO2 piezo type mechanosensitive ion channel component 2 18 -4.79
FOXN2 forkhead box N2 2 2.75
TMEM140 transmembrane protein 140 7 4.75
ABCA5 ATP binding cassette subfamily A member 5 17 3.53
SMO smoothened, frizzled class receptor 7 -3.44
ZHX3 zinc fingers and homeoboxes 3 20 2.69
SCGN secretagogin, EF-hand calcium binding protein 6 5.45
EFNA5 ephrin A5 5 -7.65
ADAMTS19 ADAM metallopeptidase with thrombospondin type 1 motif 19 5 -4.72
DIPK2A divergent protein kinase domain 2A 3 -2.56
AveExpr t P.Value adj.P.Val
SCN3A 2.8488 9.61 2.71e-11 4.91e-07
PRSS35 1.2339 -8.56 3.91e-10 3.54e-06
GREM2 0.9132 -7.76 3.39e-09 2.05e-05
SULT1E1 -0.0273 -7.01 2.88e-08 1.31e-04
MEG3 5.1340 -6.60 9.42e-08 3.42e-04
CBFA2T3 3.5461 6.15 3.38e-07 1.02e-03
IGF2BP3 4.2625 -6.04 4.64e-07 1.20e-03
PRDM6 3.4719 -5.83 8.56e-07 1.94e-03
TOX 5.3599 -5.75 1.10e-06 2.22e-03
ZNF730 3.7126 -5.31 3.92e-06 7.10e-03
PIEZO2 4.5298 -5.26 4.66e-06 7.69e-03
FOXN2 6.4531 5.21 5.16e-06 7.80e-03
TMEM140 3.8273 5.17 6.03e-06 8.42e-03
ABCA5 6.0513 5.09 7.34e-06 9.51e-03
SMO 4.2321 -4.99 1.00e-05 1.12e-02
ZHX3 7.1493 4.98 1.03e-05 1.12e-02
SCGN 1.1424 4.97 1.09e-05 1.12e-02
EFNA5 7.6269 -4.99 1.12e-05 1.12e-02
ADAMTS19 4.5895 -4.94 1.17e-05 1.12e-02
DIPK2A 5.2809 -4.88 1.35e-05 1.20e-02DCM vs Fetal
topTreat(treat.smc,coef=2,n=20,p.value=0.05)[,-c(1:3)] GENENAME CHR logFC
SCN3A sodium voltage-gated channel alpha subunit 3 2 8.64
PRSS35 serine protease 35 6 -5.59
GREM2 gremlin 2, DAN family BMP antagonist 1 -5.48
CBFA2T3 CBFA2/RUNX1 partner transcriptional co-repressor 3 16 5.99
DIPK2A divergent protein kinase domain 2A 3 -3.45
SULT1E1 sulfotransferase family 1E member 1 4 -6.62
PIEZO2 piezo type mechanosensitive ion channel component 2 18 -6.32
PRDM6 PR/SET domain 6 5 -5.17
ST6GALNAC5 ST6 N-acetylgalactosaminide alpha-2,6-sialyltransferase 5 1 -7.21
MYH10 myosin heavy chain 10 17 -4.03
CHRD chordin 3 4.41
IGF2BP3 insulin like growth factor 2 mRNA binding protein 3 7 -4.30
IGF2BP1 insulin like growth factor 2 mRNA binding protein 1 17 -4.58
MYL6B myosin light chain 6B 12 -2.83
ABCA5 ATP binding cassette subfamily A member 5 17 3.56
CNGA1 cyclic nucleotide gated channel subunit alpha 1 4 4.37
PTPRZ1 protein tyrosine phosphatase receptor type Z1 7 -5.47
TBX2 T-box transcription factor 2 17 2.86
PTPRD protein tyrosine phosphatase receptor type D 9 -2.55
LINC01811 long intergenic non-protein coding RNA 1811 3 -4.40
AveExpr t P.Value adj.P.Val
SCN3A 2.8488 11.16 6.25e-13 1.13e-08
PRSS35 1.2339 -10.30 4.70e-12 4.26e-08
GREM2 0.9132 -9.52 3.27e-11 1.97e-07
CBFA2T3 3.5461 7.99 1.84e-09 8.36e-06
DIPK2A 5.2809 -7.83 2.82e-09 1.02e-05
SULT1E1 -0.0273 -7.77 3.47e-09 1.05e-05
PIEZO2 4.5298 -7.37 1.03e-08 2.66e-05
PRDM6 3.4719 -7.26 1.40e-08 3.17e-05
ST6GALNAC5 3.6014 -6.96 3.37e-08 6.65e-05
MYH10 6.8967 -6.92 3.67e-08 6.65e-05
CHRD 1.9080 6.87 4.24e-08 6.98e-05
IGF2BP3 4.2625 -6.64 8.06e-08 1.22e-04
IGF2BP1 1.4304 -6.24 2.58e-07 3.60e-04
MYL6B 3.0581 -5.92 6.39e-07 7.83e-04
ABCA5 6.0513 5.92 6.47e-07 7.83e-04
CNGA1 2.5428 5.89 7.14e-07 8.10e-04
PTPRZ1 3.4820 -5.84 8.55e-07 9.12e-04
TBX2 4.1036 5.61 1.58e-06 1.59e-03
PTPRD 7.0721 -5.55 1.94e-06 1.85e-03
LINC01811 0.9844 -5.52 2.11e-06 1.89e-03DCM vs ND
topTreat(treat.smc,coef=3)[,-c(1:3)] GENENAME CHR logFC AveExpr t
CDK9 cyclin dependent kinase 9 9 2.56 4.304 5.85
TEDC1 tubulin epsilon and delta complex 1 14 3.43 1.701 5.84
PHF2 PHD finger protein 2 9 2.39 5.564 5.30
CCDC190 coiled-coil domain containing 190 1 3.63 1.556 4.87
LINC02507 long intergenic non-protein coding RNA 2507 4 4.23 1.003 4.87
OSR2 odd-skipped related transciption factor 2 8 -4.07 0.794 -4.85
RHOT2 ras homolog family member T2 16 2.12 5.072 4.69
ARHGAP28 Rho GTPase activating protein 28 18 -5.26 4.042 -4.43
SLC35F4 solute carrier family 35 member F4 14 -3.82 1.992 -4.38
LINC01592 long intergenic non-protein coding RNA 1592 8 -5.18 1.478 -4.37
P.Value adj.P.Val
CDK9 7.99e-07 0.00747
TEDC1 8.23e-07 0.00747
PHF2 4.03e-06 0.02440
CCDC190 1.44e-05 0.04601
LINC02507 1.45e-05 0.04601
OSR2 1.52e-05 0.04601
RHOT2 2.39e-05 0.06195
ARHGAP28 5.36e-05 0.11509
SLC35F4 6.00e-05 0.11509
LINC01592 6.34e-05 0.11509Male vs Female in Fetal samples
topTreat(treat.smc,coef=4,n=20,p.value=0.05)[,-c(1:3)] GENENAME CHR logFC
GREM2 gremlin 2, DAN family BMP antagonist 1 -8.63
IQCA1 IQ motif containing with AAA domain 1 2 -5.65
GPHA2 glycoprotein hormone subunit alpha 2 11 -4.87
SFRP2 secreted frizzled related protein 2 4 -8.60
MOV10L1 Mov10 like RISC complex RNA helicase 1 22 -6.14
OSR1 odd-skipped related transcription factor 1 2 -6.90
LINC01886 long intergenic non-protein coding RNA 1886 2 -5.59
ADORA2B adenosine A2b receptor 17 6.44
CHRD chordin 3 6.25
MOCOS molybdenum cofactor sulfurase 18 -4.07
FOXCUT FOXC1 upstream transcript 6 -5.05
ENPP1 ectonucleotide pyrophosphatase/phosphodiesterase 1 6 -5.03
MIR3681HG MIR3681 host gene 2 -4.83
RAB3C RAB3C, member RAS oncogene family 5 -5.99
OSR2 odd-skipped related transciption factor 2 8 -4.86
LRRC3B leucine rich repeat containing 3B 3 -5.73
LINC00578 long intergenic non-protein coding RNA 578 3 -4.98
SPTBN4 spectrin beta, non-erythrocytic 4 19 -3.77
ADAMTS17 ADAM metallopeptidase with thrombospondin type 1 motif 17 15 -5.09
EPHB2 EPH receptor B2 1 -4.79
AveExpr t P.Value adj.P.Val
GREM2 0.913 -13.78 2.09e-15 3.80e-11
IQCA1 2.302 -7.70 4.13e-09 3.75e-05
GPHA2 -2.139 -7.39 9.64e-09 5.83e-05
SFRP2 -1.226 -7.12 2.20e-08 9.96e-05
MOV10L1 1.553 -6.71 6.75e-08 2.45e-04
OSR1 0.720 -6.28 2.43e-07 6.41e-04
LINC01886 -0.112 -6.26 2.47e-07 6.41e-04
ADORA2B 2.604 6.02 5.03e-07 1.05e-03
CHRD 1.908 6.01 5.20e-07 1.05e-03
MOCOS 2.157 -5.53 2.07e-06 3.75e-03
FOXCUT -1.691 -5.47 2.52e-06 4.15e-03
ENPP1 3.902 -5.34 3.67e-06 5.55e-03
MIR3681HG 2.949 -5.18 5.75e-06 7.43e-03
RAB3C 1.958 -5.19 5.85e-06 7.43e-03
OSR2 0.794 -5.16 6.14e-06 7.43e-03
LRRC3B 0.778 -5.11 7.39e-06 7.87e-03
LINC00578 2.782 -5.10 7.51e-06 7.87e-03
SPTBN4 3.342 -5.07 7.81e-06 7.87e-03
ADAMTS17 5.017 -4.99 1.03e-05 9.83e-03
EPHB2 3.111 -4.96 1.11e-05 1.01e-02Male vs Female in ND samples
topTreat(treat.smc,coef=5)[,-c(1:3)] GENENAME CHR logFC
PHF2 PHD finger protein 2 9 4.05
MPHOSPH10 M-phase phosphoprotein 10 2 3.90
RHOT2 ras homolog family member T2 16 3.75
ACTR6 actin related protein 6 12 3.51
FBXW5 F-box and WD repeat domain containing 5 9 3.51
EIF2B5 eukaryotic translation initiation factor 2B subunit epsilon 3 2.93
MED21 mediator complex subunit 21 12 3.49
GABPA GA binding protein transcription factor subunit alpha 21 3.10
ZBTB3 zinc finger and BTB domain containing 3 11 -3.20
EFCAB6 EF-hand calcium binding domain 6 22 3.80
AveExpr t P.Value adj.P.Val
PHF2 5.56 6.00 5.12e-07 0.00468
MPHOSPH10 5.03 6.00 5.16e-07 0.00468
RHOT2 5.07 5.73 1.13e-06 0.00611
ACTR6 4.31 5.67 1.35e-06 0.00611
FBXW5 4.39 4.74 2.08e-05 0.07562
EIF2B5 3.75 4.60 3.12e-05 0.09447
MED21 4.43 4.42 5.23e-05 0.13546
GABPA 5.11 4.25 8.46e-05 0.19195
ZBTB3 1.78 -4.20 9.94e-05 0.19915
EFCAB6 4.50 4.17 1.10e-04 0.19915Male vs Female in DCM samples
topTreat(treat.smc,coef=6)[,-c(1:3)] GENENAME CHR logFC AveExpr t
MYL6B myosin light chain 6B 12 -3.35 3.06 -4.97
HEBP1 heme binding protein 1 12 -4.23 3.52 -4.88
MTLN mitoregulin 2 -3.56 3.18 -4.32
NBPF3 NBPF member 3 1 -4.05 3.75 -4.20
COPZ2 COPI coat complex subunit zeta 2 17 -3.85 3.05 -3.85
ZBTB3 zinc finger and BTB domain containing 3 11 -2.73 1.78 -3.76
ROMO1 reactive oxygen species modulator 1 20 -3.94 3.01 -3.70
PSMG3-AS1 PSMG3 antisense RNA 1 (head to head) 7 -3.59 2.85 -3.69
IFT22 intraflagellar transport 22 7 -3.24 1.97 -3.61
RAB29 RAB29, member RAS oncogene family 1 -3.58 2.94 -3.53
P.Value adj.P.Val
MYL6B 1.05e-05 0.124
HEBP1 1.37e-05 0.124
MTLN 6.99e-05 0.423
NBPF3 1.02e-04 0.461
COPZ2 2.69e-04 0.953
ZBTB3 3.42e-04 0.953
ROMO1 4.15e-04 0.953
PSMG3-AS1 4.20e-04 0.953
IFT22 5.21e-04 1.000
RAB29 6.63e-04 1.000Interaction of sex differences between DCM and Fetal
topTreat(treat.smc,coef=7)[,-c(1:3)] GENENAME CHR logFC
GREM2 gremlin 2, DAN family BMP antagonist 1 7.80
GPHA2 glycoprotein hormone subunit alpha 2 11 4.90
SPTBN4 spectrin beta, non-erythrocytic 4 19 5.90
IQCA1 IQ motif containing with AAA domain 1 2 6.57
ADORA2B adenosine A2b receptor 17 -7.24
MIR3681HG MIR3681 host gene 2 7.38
MOV10L1 Mov10 like RISC complex RNA helicase 1 22 8.09
SNN stannin 16 -5.89
PDGFA platelet derived growth factor subunit A 7 -4.40
ADAMTS17 ADAM metallopeptidase with thrombospondin type 1 motif 17 15 6.42
AveExpr t P.Value adj.P.Val
GREM2 0.913 6.97 3.33e-08 0.000604
GPHA2 -2.139 5.39 3.14e-06 0.018613
SPTBN4 3.342 5.35 3.63e-06 0.018613
IQCA1 2.302 5.22 5.45e-06 0.018613
ADORA2B 2.604 -5.19 6.12e-06 0.018613
MIR3681HG 2.949 5.19 6.16e-06 0.018613
MOV10L1 1.553 5.05 9.47e-06 0.024550
SNN 1.773 -4.72 2.30e-05 0.052225
PDGFA 4.292 -4.50 4.20e-05 0.083247
ADAMTS17 5.017 4.50 4.59e-05 0.083247Interaction of sex differences between ND and Fetal
topTreat(treat.smc,coef=8)[,-c(1:3)] GENENAME CHR logFC
GREM2 gremlin 2, DAN family BMP antagonist 1 8.77
PHF2 PHD finger protein 2 9 5.40
GPHA2 glycoprotein hormone subunit alpha 2 11 5.09
ACTR6 actin related protein 6 12 4.23
HARBI1 harbinger transposase derived 1 11 -7.11
RHOT2 ras homolog family member T2 16 4.25
EIF2B5 eukaryotic translation initiation factor 2B subunit epsilon 3 3.85
SPTBN4 spectrin beta, non-erythrocytic 4 19 5.36
MYRF myelin regulatory factor 11 6.27
OSR2 odd-skipped related transciption factor 2 8 6.54
AveExpr t P.Value adj.P.Val
GREM2 0.913 7.61 5.58e-09 0.000101
PHF2 5.564 6.50 1.23e-07 0.001116
GPHA2 -2.139 5.47 2.52e-06 0.015221
ACTR6 4.315 5.27 4.42e-06 0.020042
HARBI1 1.853 -5.17 6.37e-06 0.023116
RHOT2 5.072 5.06 8.15e-06 0.024641
EIF2B5 3.746 4.65 2.70e-05 0.070086
SPTBN4 3.342 4.50 4.39e-05 0.097537
MYRF 1.102 4.48 4.84e-05 0.097537
OSR2 0.794 4.37 6.71e-05 0.104126Interaction of sex differences between DCM and ND
topTreat(treat.smc,coef=9)[,-c(1:3)] GENENAME CHR logFC AveExpr
MYL6B myosin light chain 6B 12 -5.40 3.06
PHF2 PHD finger protein 2 9 -4.30 5.56
MPHOSPH10 M-phase phosphoprotein 10 2 -4.00 5.03
SGSH N-sulfoglucosamine sulfohydrolase 17 5.16 2.44
HEBP2 heme binding protein 2 6 -5.96 4.01
ASPHD1 aspartate beta-hydroxylase domain containing 1 16 -5.70 2.93
MANEA mannosidase endo-alpha 6 -4.40 4.02
DDX49 DEAD-box helicase 49 19 -4.64 3.75
IFT22 intraflagellar transport 22 7 -4.89 1.97
SLC16A5 solute carrier family 16 member 5 17 4.55 2.97
t P.Value adj.P.Val
MYL6B -5.83 8.73e-07 0.0158
PHF2 -5.33 3.72e-06 0.0337
MPHOSPH10 -4.87 1.44e-05 0.0870
SGSH 4.61 3.18e-05 0.1441
HEBP2 -4.26 8.94e-05 0.3245
ASPHD1 -4.09 1.45e-04 0.3831
MANEA -4.03 1.65e-04 0.3831
DDX49 -3.97 1.98e-04 0.3831
IFT22 -3.96 2.06e-04 0.3831
SLC16A5 3.95 2.11e-04 0.3831par(mar=c(5,5,3,2))
par(mar=c(5,5,3,2))
plot(treat.smc$coefficients[,1],treat.smc$coefficients[,2],xlab="logFC: ND vs Fetal", ylab="logFC: DCM vs Fetal",main="smooth muscle cells",col=rgb(0,0,1,alpha=0.25),pch=16,cex=0.8)
abline(h=0,v=0,col=colours()[c(175)])
sig.genes <- dt.smc[,1] !=0 | dt.smc[,2] != 0
text(treat.smc$coefficients[sig.genes,1],treat.smc$coefficients[sig.genes,2],labels=rownames(dt.smc)[sig.genes],col=2,cex=0.6)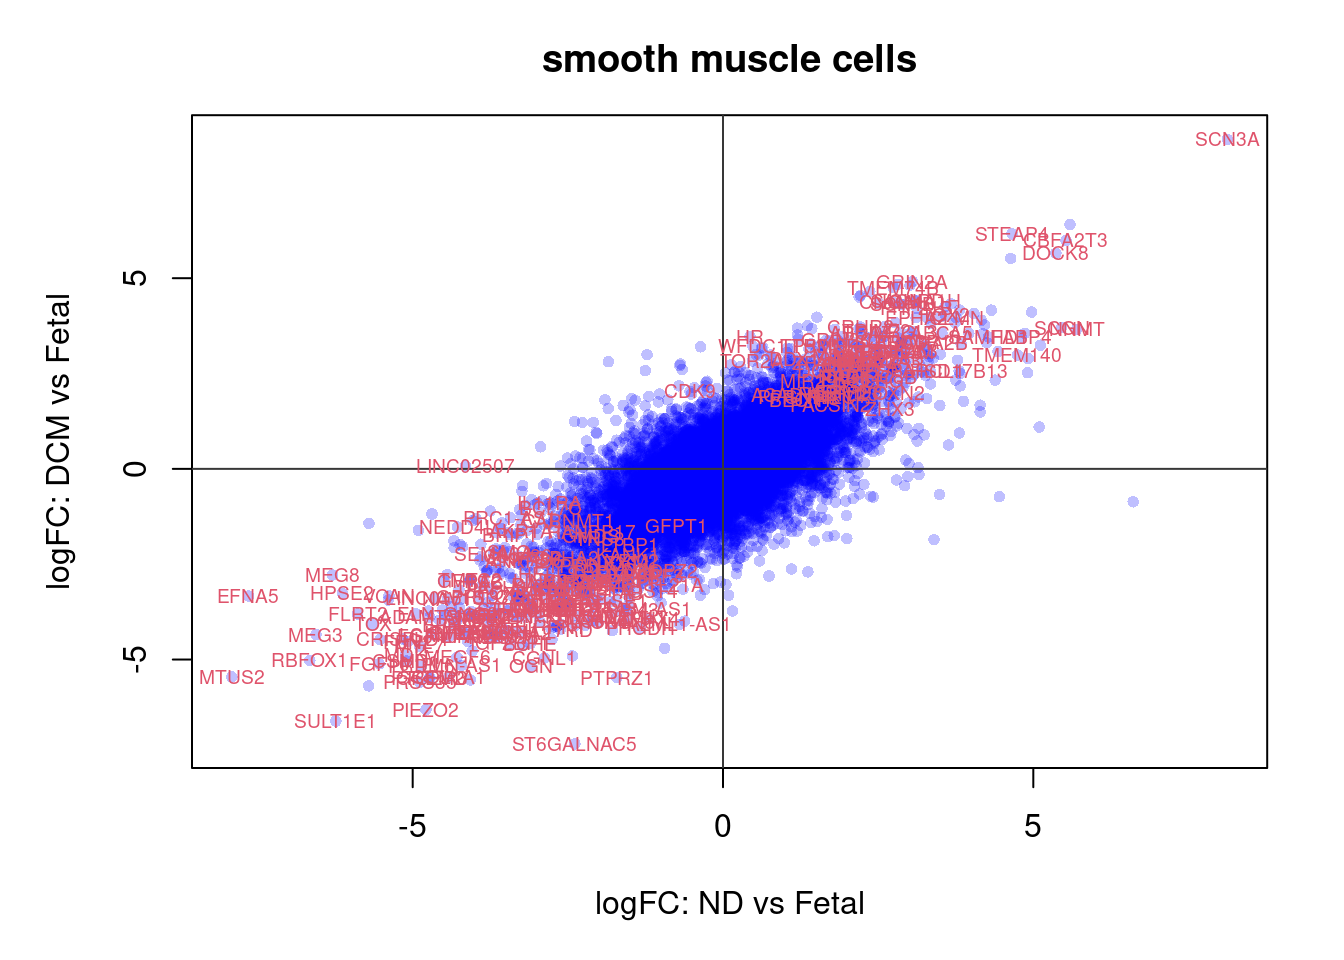
par(mar=c(5,5,3,2))
plot(treat.smc$coefficients[,4],treat.smc$coefficients[,5],xlab="logFC: Fetal Male vs Female", ylab="logFC: ND Male vs Female",main="smooth muscle cells: Sex differences - Fetal and ND",col=rgb(0,0,1,alpha=0.25),pch=16,cex=0.8)
abline(h=0,v=0)
sig.genes <- dt.smc[,4] !=0 | dt.smc[,5] != 0
text(treat.smc$coefficients[sig.genes,4],treat.smc$coefficients[sig.genes,5],labels=rownames(dt.smc)[sig.genes],col=2,cex=0.6)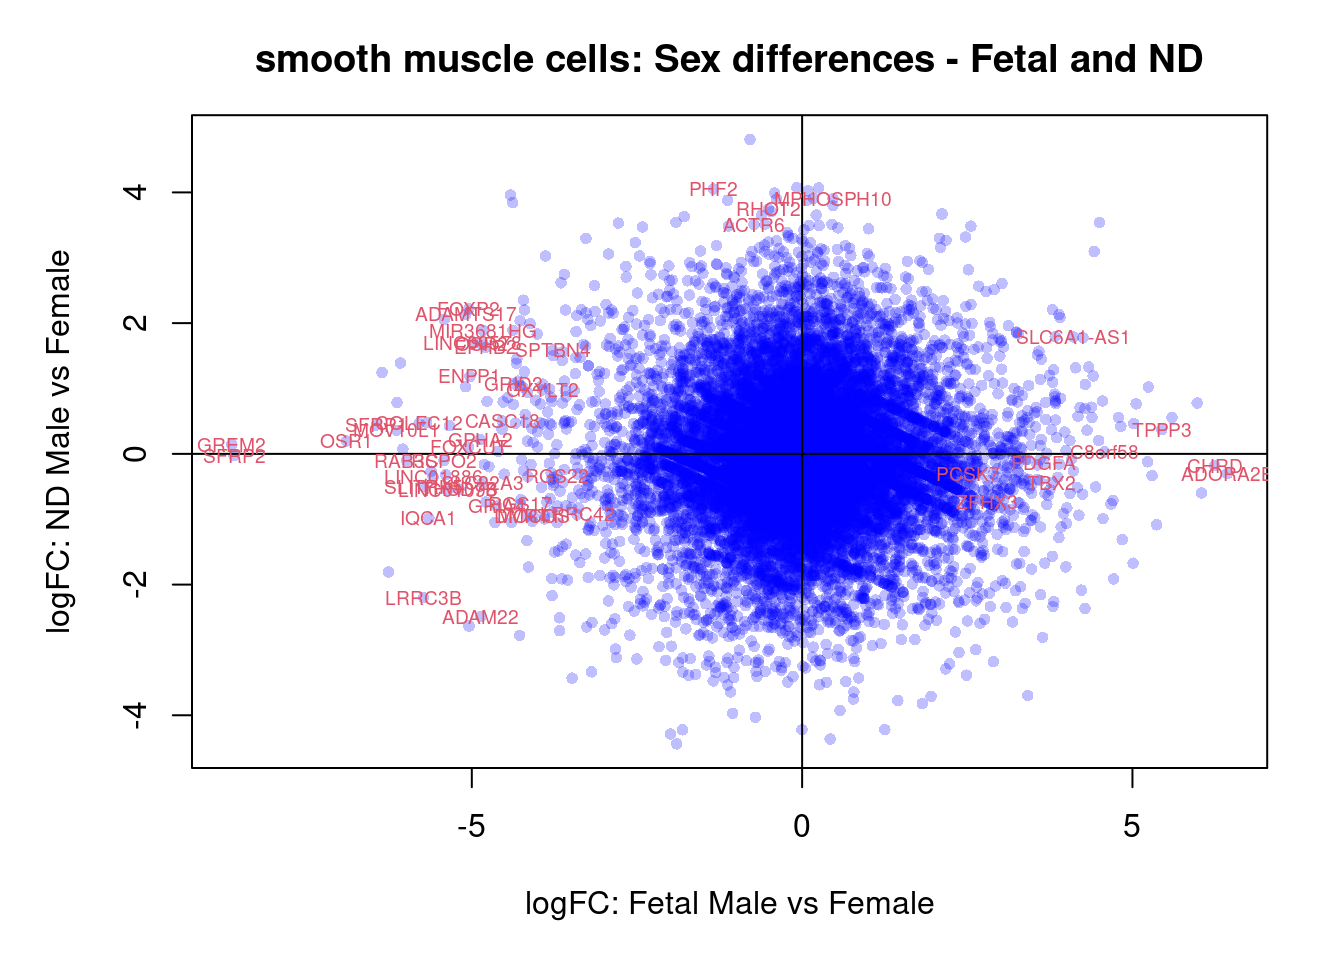
par(mar=c(5,5,3,2))
plot(treat.smc$coefficients[,4],treat.smc$coefficients[,6],xlab="logFC: Fetal Male vs Female", ylab="logFC: DCM Male vs Female",main="smooth muscle cells: Sex differences - Fetal and DCM",col=rgb(0,0,1,alpha=0.25),pch=16,cex=0.8)
abline(h=0,v=0)
sig.genes <- dt.smc[,4] !=0 | dt.smc[,6] != 0
text(treat.smc$coefficients[sig.genes,4],treat.smc$coefficients[sig.genes,6],labels=rownames(dt.smc)[sig.genes],col=2,cex=0.6)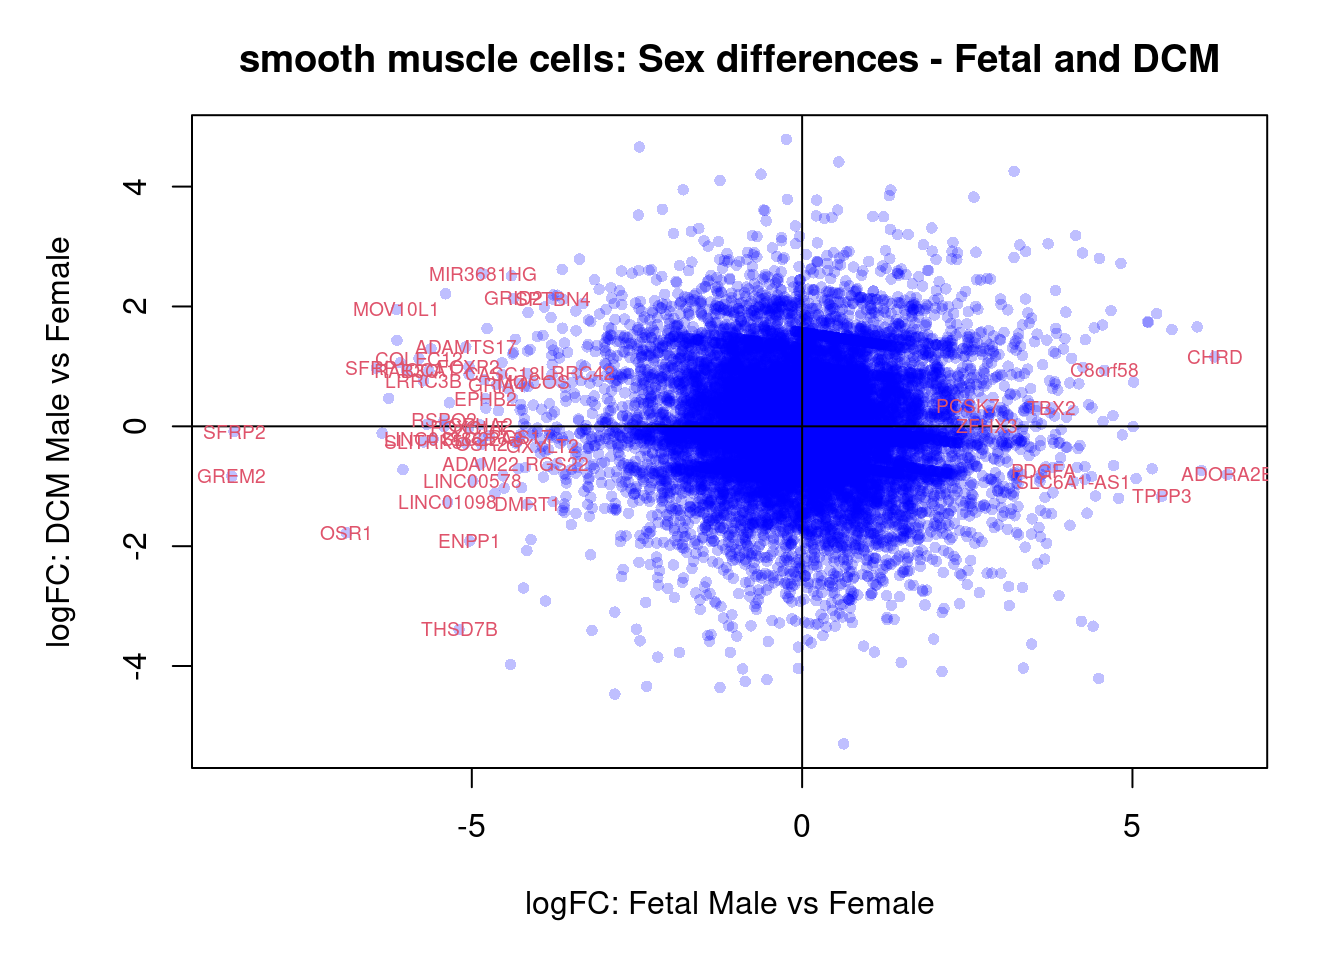
par(mar=c(5,5,3,2))
plot(treat.smc$coefficients[,5],treat.smc$coefficients[,6],xlab="logFC: ND Male vs Female", ylab="logFC: DCM Male vs Female",main="smooth muscle cells: Sex differences - ND and DCM",col=rgb(0,0,1,alpha=0.25),pch=16,cex=0.8)
sig.genes <- dt.smc[,5] !=0 | dt.smc[,6] != 0
text(treat.smc$coefficients[sig.genes,5],treat.smc$coefficients[sig.genes,6],labels=rownames(dt.smc)[sig.genes],col=2,cex=0.6)
abline(h=0,v=0)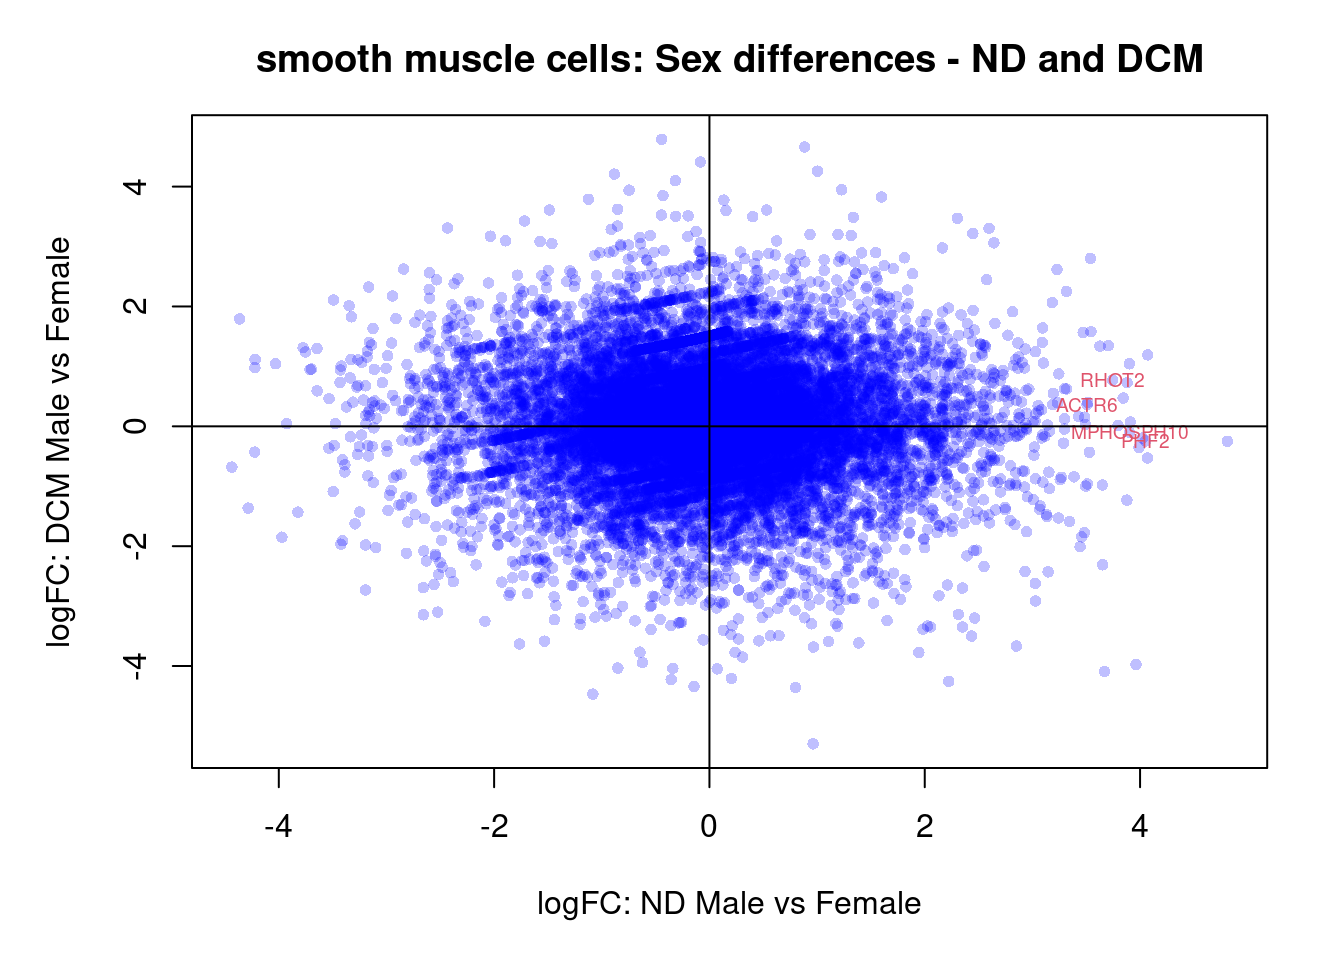
par(mar=c(5,5,3,2))
plot(treat.smc$coefficients[,4],treat.smc$coefficients[,5],xlab="logFC: Fetal Male vs Female", ylab="logFC: ND Male vs Female",main="smooth muscle cells: Interaction term: Fetal vs ND",col=rgb(0,0,1,alpha=0.25),pch=16,cex=0.8)
abline(h=0,v=0)
sig.genes <- dt.smc[,8] !=0
text(treat.smc$coefficients[sig.genes,4],treat.smc$coefficients[sig.genes,5],labels=rownames(dt.smc)[sig.genes],col=2,cex=0.6)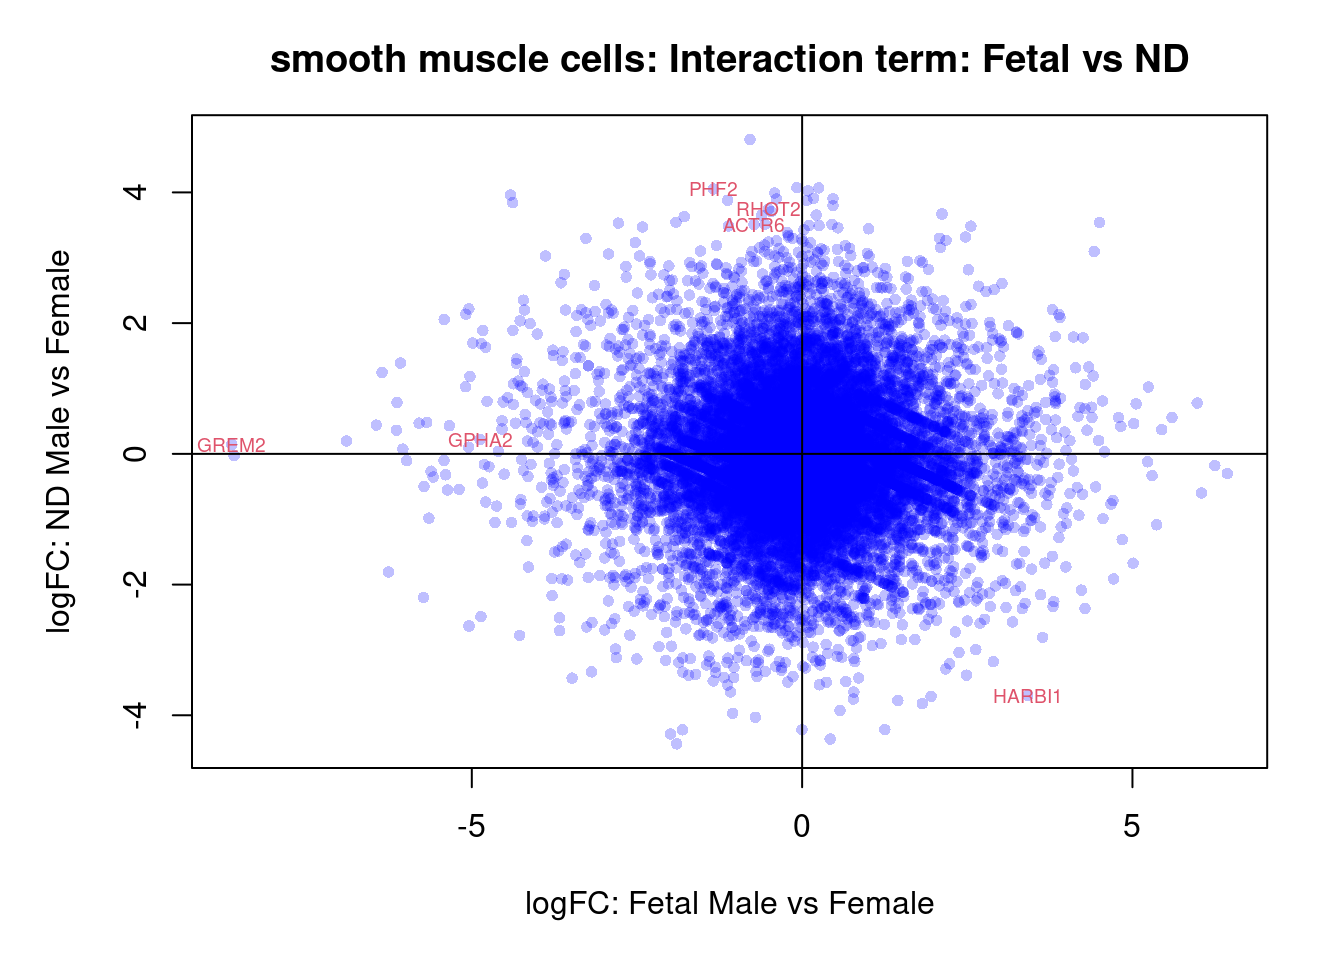
par(mar=c(5,5,3,2))
plot(treat.smc$coefficients[,4],treat.smc$coefficients[,6],xlab="logFC: Fetal Male vs Female", ylab="logFC: DCM Male vs Female",main="smooth muscle cells: Interaction term: Fetal and DCM",col=rgb(0,0,1,alpha=0.25),pch=16,cex=0.8)
abline(h=0,v=0)
sig.genes <- dt.smc[,7] !=0
text(treat.smc$coefficients[sig.genes,4],treat.smc$coefficients[sig.genes,6],labels=rownames(dt.smc)[sig.genes],col=2,cex=0.6)
par(mar=c(5,5,3,2))
plot(treat.smc$coefficients[,5],treat.smc$coefficients[,6],xlab="logFC: ND Male vs Female", ylab="logFC: DCM Male vs Female",main="smooth muscle cells: Interaction term: ND and DCM",col=rgb(0,0,1,alpha=0.25),pch=16,cex=0.8)
abline(h=0,v=0)
sig.genes <- dt.smc[,9] !=0
if(sum(sig.genes)!=0){
  text(treat.smc$coefficients[sig.genes,5],treat.smc$coefficients[sig.genes,6],
       labels=rownames(dt.smc)[sig.genes],col=2,cex=0.6)
}
Endothelial cells
cont.endo <- makeContrasts(NvF = 0.5*(endo.ND.Male + endo.ND.Female) - 0.5*(endo.Fetal.Male + endo.Fetal.Female),
                         DvF = 0.5*(endo.DCM.Male + endo.DCM.Female) - 0.5*(endo.Fetal.Male + endo.Fetal.Female),
                         DvN = 0.5*(endo.DCM.Male + endo.DCM.Female) - 0.5*(endo.ND.Male + endo.ND.Female),
                         SexFetal = endo.Fetal.Male - endo.Fetal.Female,
                         SexND = endo.ND.Male - endo.ND.Female,
                         SexDCM = endo.DCM.Male - endo.DCM.Female,
                         InteractionDF = (endo.DCM.Male - endo.Fetal.Male) - (endo.DCM.Female - endo.Fetal.Female),
                         InteractionNF = (endo.ND.Male - endo.Fetal.Male) - (endo.ND.Female - endo.Fetal.Female),
                         InteractionDN = (endo.DCM.Male - endo.ND.Male) - (endo.DCM.Female - endo.ND.Female),
                         levels=design)
fit.endo <- contrasts.fit(fit,contrasts = cont.endo)
fit.endo <- eBayes(fit.endo,robust=TRUE)

summary(decideTests(fit.endo))
NvF DvF DvN SexFetal SexND SexDCM InteractionDF InteractionNF
Down 722 1197 70 7 0 32 0 0
NotSig 16832 15550 17946 18133 18141 18063 18140 18141
Up 587 1394 125 1 0 46 1 0
InteractionDN
Down 1
NotSig 18136
Up 4treat.endo <- treat(fit.endo,lfc=0.5)
dt.endo<-decideTests(treat.endo)
summary(dt.endo) NvF DvF DvN SexFetal SexND SexDCM InteractionDF InteractionNF
Down 302 406 7 4 0 5 0 0
NotSig 17662 17360 18129 18137 18141 18131 18141 18141
Up 177 375 5 0 0 5 0 0
InteractionDN
Down 1
NotSig 18137
Up 3par(mfrow=c(3,3))
for(i in 1:9){
plotMD(treat.endo,coef=i,status=dt.endo[,i],hl.col=c("blue","red"))
abline(h=0,col="grey")
}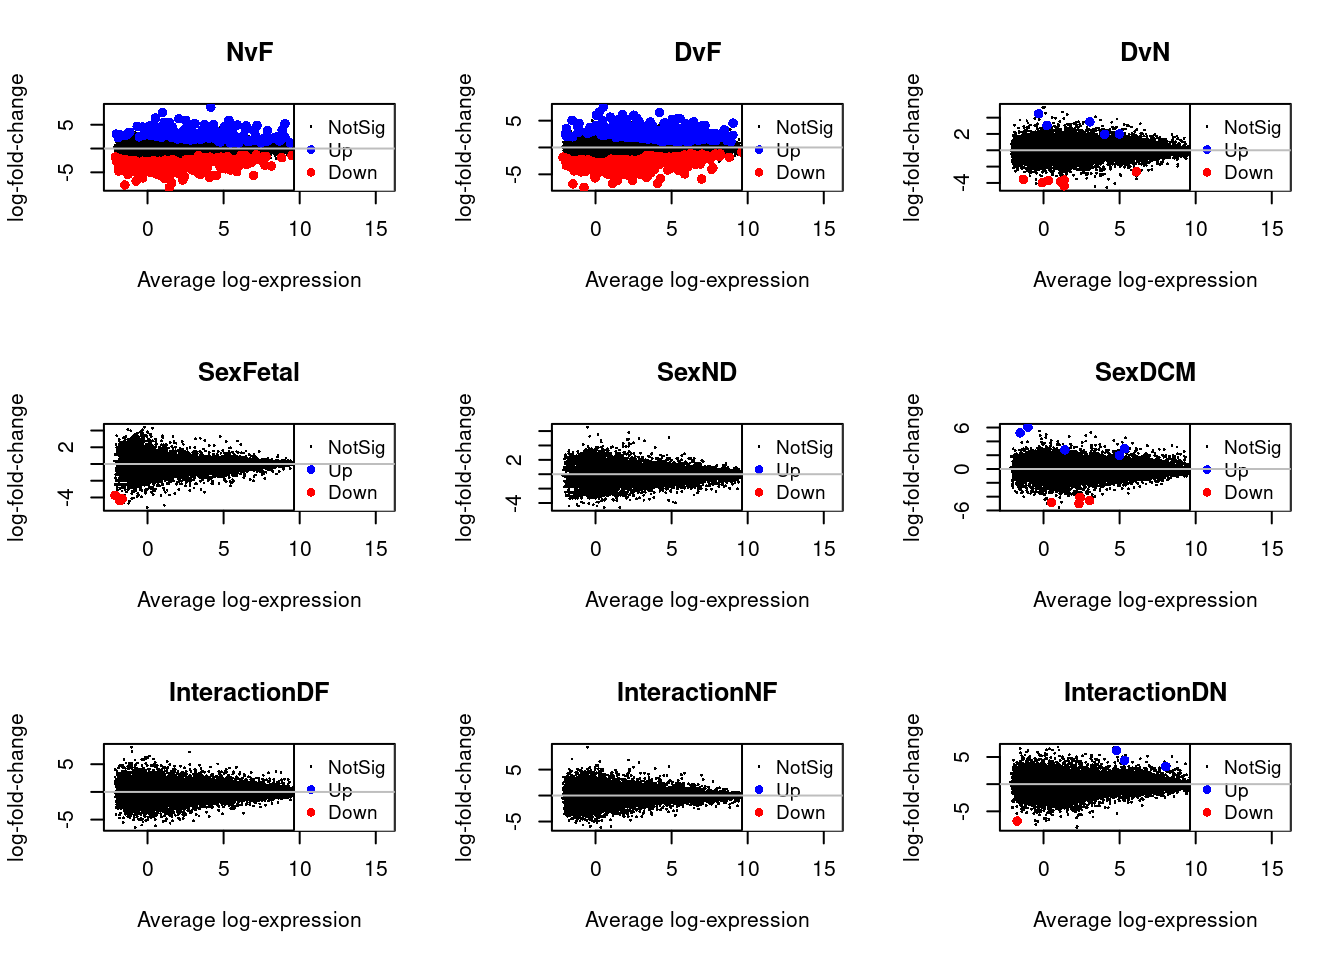
par(mfrow=c(1,1))
par(mar=c(7,4,2,2))
barplot(summary(dt.endo)[-2,],beside=TRUE,legend=TRUE,col=c("blue","red"),ylab="Number of significant genes",las=2)
title("Endothelial cells")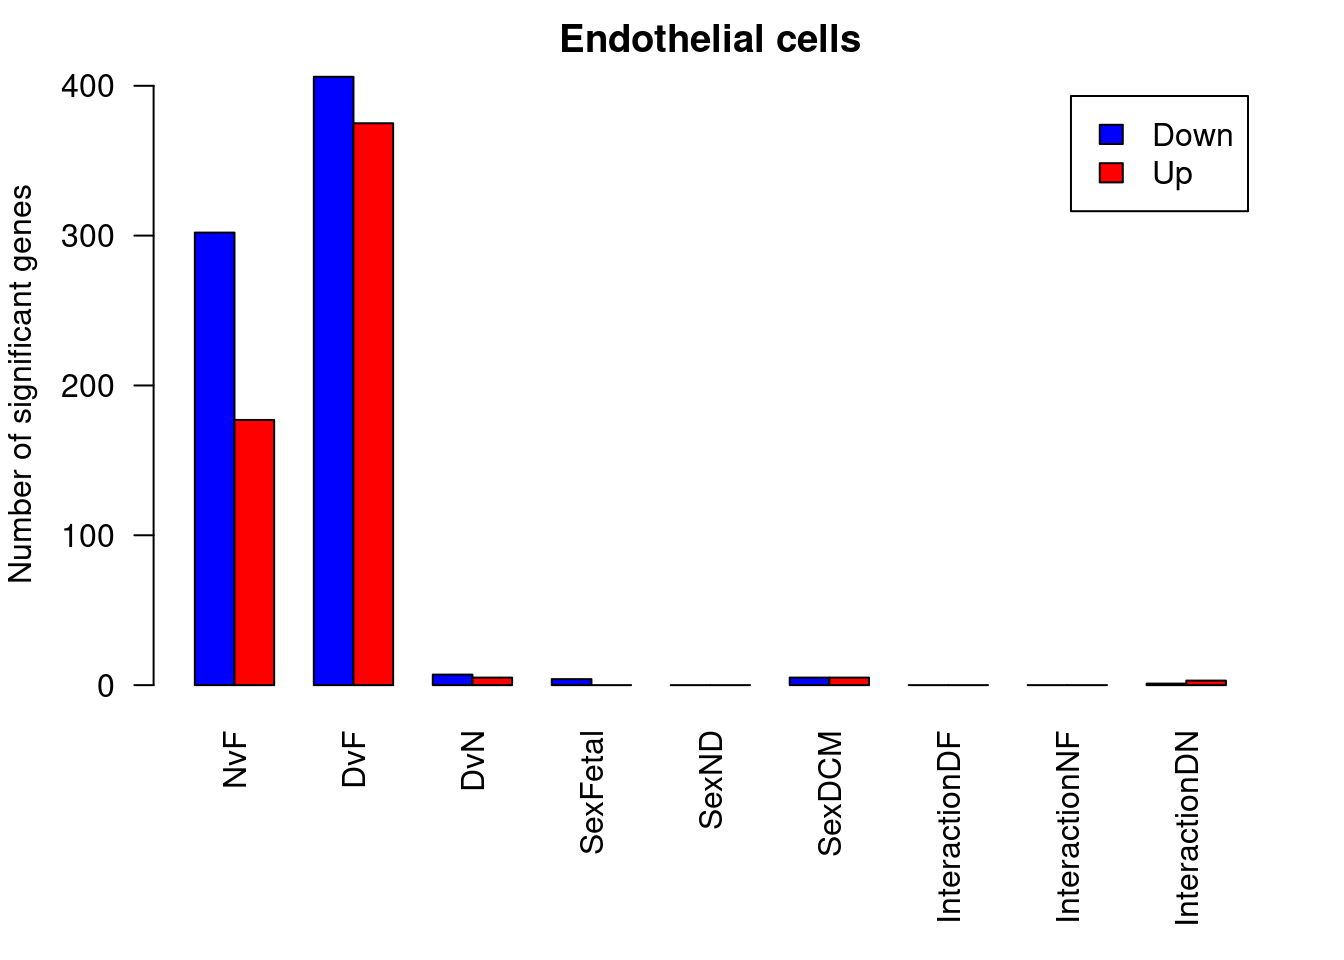
ND vs Fetal
options(digits=3)
topTreat(treat.endo,coef=1,n=20,p.value=0.05)[,-c(1:3)]
GENENAME
PRND prion like protein doppel
NTS neurotensin
PRSS35 serine protease 35
TMTC1 transmembrane O-mannosyltransferase targeting cadherins 1
TIMP4 TIMP metallopeptidase inhibitor 4
IGF2BP3 insulin like growth factor 2 mRNA binding protein 3
HOXD9 homeobox D9
OR51E1 olfactory receptor family 51 subfamily E member 1
PEG10 paternally expressed 10
DLK1 delta like non-canonical Notch ligand 1
HBA1 hemoglobin subunit alpha 1
IGF2BP1 insulin like growth factor 2 mRNA binding protein 1
HOXD3 homeobox D3
PIK3C2A phosphatidylinositol-4-phosphate 3-kinase catalytic subunit type 2 alpha
HOXD-AS2 HOXD cluster antisense RNA 2
LNX1 ligand of numb-protein X 1
OIT3 oncoprotein induced transcript 3
PIEZO2 piezo type mechanosensitive ion channel component 2
CLRN1-AS1 CLRN1 antisense RNA 1
FOLH1 folate hydrolase 1
CHR logFC AveExpr t P.Value adj.P.Val
PRND 20 -7.67 -1.486 -20.53 1.83e-20 3.32e-16
NTS 12 -6.83 -0.749 -13.98 1.38e-15 1.25e-11
PRSS35 6 -5.57 1.234 -10.38 3.87e-12 2.34e-08
TMTC1 12 3.74 7.873 10.01 9.47e-12 4.30e-08
TIMP4 3 7.57 0.979 9.47 3.76e-11 1.36e-07
IGF2BP3 7 -5.67 4.262 -9.31 5.56e-11 1.68e-07
HOXD9 2 -4.72 -1.889 -9.11 9.21e-11 2.16e-07
OR51E1 11 6.43 0.525 9.10 9.50e-11 2.16e-07
PEG10 7 -6.25 1.153 -8.89 1.67e-10 3.37e-07
DLK1 14 -7.21 1.581 -8.61 3.55e-10 6.44e-07
HBA1 16 -8.20 1.428 -8.49 5.02e-10 8.29e-07
IGF2BP1 17 -5.71 1.430 -8.33 7.23e-10 1.09e-06
HOXD3 2 -6.17 -0.315 -7.79 3.18e-09 4.22e-06
PIK3C2A 11 1.82 7.601 7.78 3.26e-09 4.22e-06
HOXD-AS2 2 -4.90 -1.200 -7.33 1.14e-08 1.38e-05
LNX1 4 5.03 3.740 7.19 1.71e-08 1.94e-05
OIT3 10 -4.20 0.979 -7.13 2.01e-08 2.15e-05
PIEZO2 18 -5.63 4.530 -7.02 2.79e-08 2.81e-05
CLRN1-AS1 3 -4.52 0.700 -6.84 4.57e-08 4.24e-05
FOLH1 11 -5.38 0.615 -6.84 4.68e-08 4.24e-05DCM vs Fetal
topTreat(treat.endo,coef=2,n=20,p.value=0.05)[,-c(1:3)] GENENAME CHR logFC
PRND prion like protein doppel 20 -6.80
NTS neurotensin 12 -7.47
PRSS35 serine protease 35 6 -6.00
IGF2BP1 insulin like growth factor 2 mRNA binding protein 1 17 -6.19
IGF2BP3 insulin like growth factor 2 mRNA binding protein 3 7 -5.80
LAMA5 laminin subunit alpha 5 20 2.75
RASGRF2 Ras protein specific guanine nucleotide releasing factor 2 5 4.56
INHBB inhibin subunit beta B 2 6.51
IGF2BP2 insulin like growth factor 2 mRNA binding protein 2 3 -3.08
CLRN1-AS1 CLRN1 antisense RNA 1 3 -4.78
PEG10 paternally expressed 10 7 -5.31
PRCP prolylcarboxypeptidase 11 -2.35
NCAPG non-SMC condensin I complex subunit G 4 -5.14
OIT3 oncoprotein induced transcript 3 10 -4.43
SOX11 SRY-box transcription factor 11 2 -6.70
PITPNC1 phosphatidylinositol transfer protein cytoplasmic 1 17 3.31
ITM2C integral membrane protein 2C 2 -5.15
KIF23 kinesin family member 23 15 -4.47
CDCA7 cell division cycle associated 7 2 -4.40
NPPA natriuretic peptide A 1 -4.18
AveExpr t P.Value adj.P.Val
PRND -1.486 -18.24 6.29e-19 1.14e-14
NTS -0.749 -16.85 6.56e-18 5.95e-14
PRSS35 1.234 -12.16 6.21e-14 3.75e-10
IGF2BP1 1.430 -10.11 7.44e-12 3.37e-08
IGF2BP3 4.262 -9.97 1.06e-11 3.84e-08
LAMA5 4.551 9.30 5.58e-11 1.69e-07
RASGRF2 4.509 8.59 3.59e-10 9.30e-07
INHBB 0.223 8.43 5.61e-10 1.27e-06
IGF2BP2 6.881 -8.13 1.25e-09 2.53e-06
CLRN1-AS1 0.700 -7.71 3.95e-09 6.73e-06
PEG10 1.153 -7.70 4.08e-09 6.73e-06
PRCP 5.244 -7.49 7.19e-09 1.08e-05
NCAPG 1.576 -7.47 7.71e-09 1.08e-05
OIT3 0.979 -7.42 8.71e-09 1.08e-05
SOX11 1.114 -7.43 8.95e-09 1.08e-05
PITPNC1 8.461 7.37 1.01e-08 1.15e-05
ITM2C 3.189 -7.11 2.15e-08 2.29e-05
KIF23 1.843 -7.07 2.40e-08 2.42e-05
CDCA7 1.408 -7.00 2.86e-08 2.73e-05
NPPA 4.742 -6.97 3.13e-08 2.84e-05DCM vs ND
topTreat(treat.endo,coef=3)[,-c(1:3)] GENENAME CHR logFC AveExpr t
CSNK1G2 casein kinase 1 gamma 2 19 1.99 4.9849 6.36
SMTNL2 smoothelin like 2 17 -4.35 1.3526 -6.22
SLC7A14 solute carrier family 7 member 14 3 -3.84 1.1202 -5.13
PTHLH parathyroid hormone like hormone 12 -3.97 -0.0785 -4.83
INHBB inhibin subunit beta B 2 3.05 0.2225 4.79
HRCT1 histidine rich carboxyl terminus 1 9 -3.69 0.3175 -4.79
LYPD2 LY6/PLAUR domain containing 2 8 -3.56 -1.3327 -4.74
CDH11 cadherin 11 16 -2.63 6.1066 -4.73
LINC01117 long intergenic non-protein coding RNA 1117 2 3.49 3.0468 4.71
HOXD3 homeobox D3 2 4.48 -0.3148 4.69
P.Value adj.P.Val
CSNK1G2 1.81e-07 0.00248
SMTNL2 2.74e-07 0.00248
SLC7A14 6.64e-06 0.04012
PTHLH 1.61e-05 0.04382
INHBB 1.76e-05 0.04382
HRCT1 1.81e-05 0.04382
LYPD2 2.07e-05 0.04382
CDH11 2.11e-05 0.04382
LINC01117 2.23e-05 0.04382
HOXD3 2.42e-05 0.04382Male vs Female in Fetal samples
topTreat(treat.endo,coef=4)[,-c(1:3)] GENENAME CHR logFC AveExpr t
APOA2 apolipoprotein A2 1 -3.74 -2.107 -6.55
GPHA2 glycoprotein hormone subunit alpha 2 11 -3.74 -2.139 -5.76
BMP10 bone morphogenetic protein 10 2 -4.39 -1.817 -5.47
ADGRA1 adhesion G protein-coupled receptor A1 10 -4.16 -1.663 -5.40
ALB albumin 4 -4.44 -1.191 -4.82
CBLN4 cerebellin 4 precursor 20 -3.10 -1.963 -4.76
SMAD1-AS1 SMAD1 antisense RNA 1 4 4.12 -1.296 4.47
SCEL sciellin 13 -3.90 -0.678 -4.36
RBP4 retinol binding protein 4 10 -4.16 -1.640 -4.12
SLC6A11 solute carrier family 6 member 11 3 -4.07 -0.879 -3.88
P.Value adj.P.Val
APOA2 1.04e-07 0.00188
GPHA2 1.05e-06 0.00953
BMP10 2.46e-06 0.01351
ADGRA1 2.98e-06 0.01351
ALB 1.67e-05 0.05829
CBLN4 1.93e-05 0.05829
SMAD1-AS1 4.67e-05 0.12096
SCEL 6.39e-05 0.14487
RBP4 1.26e-04 0.25380
SLC6A11 2.49e-04 0.45236Male vs Female in ND samples
topTreat(treat.endo,coef=5)[,-c(1:3)] GENENAME CHR logFC AveExpr
UMODL1 uromodulin like 1 21 6.55 -0.516
ITLN1 intelectin 1 1 -3.87 -0.915
CLDN6 claudin 6 16 -4.01 -0.808
MAFA MAF bZIP transcription factor A 8 -4.42 -1.742
C16orf78 chromosome 16 open reading frame 78 16 3.88 -0.497
GSDMC gasdermin C 8 -4.26 -1.216
CRABP1 cellular retinoic acid binding protein 1 15 -4.42 -1.119
NKAIN2 sodium/potassium transporting ATPase interacting 2 6 -3.64 4.799
ZNF750 zinc finger protein 750 17 4.67 0.359
OPN5 opsin 5 6 5.28 -0.377
t P.Value adj.P.Val
UMODL1 5.17 6.25e-06 0.113
ITLN1 -4.67 2.55e-05 0.231
CLDN6 -4.27 8.22e-05 0.356
MAFA -4.24 9.03e-05 0.356
C16orf78 4.21 9.82e-05 0.356
GSDMC -3.97 1.93e-04 0.542
CRABP1 -3.93 2.24e-04 0.542
NKAIN2 -3.88 2.46e-04 0.542
ZNF750 3.86 2.76e-04 0.542
OPN5 3.82 3.10e-04 0.542Male vs Female in DCM samples
topTreat(treat.endo,coef=6)[,-c(1:3)] GENENAME CHR logFC AveExpr
CCDC3 coiled-coil domain containing 3 10 2.94 5.334
C4orf54 chromosome 4 open reading frame 54 4 6.06 -1.023
CSNK1G2 casein kinase 1 gamma 2 19 1.98 4.985
JRKL JRK like 11 -4.58 3.031
ERICH6-AS1 ERICH6 antisense RNA 1 3 -5.00 2.337
C5orf34 chromosome 5 open reading frame 34 5 -4.16 2.415
LYSMD1 LysM domain containing 1 1 -4.09 2.383
ATAD3C ATPase family AAA domain containing 3C 1 2.76 1.401
OR51E1 olfactory receptor family 51 subfamily E member 1 11 -4.87 0.525
CSF3 colony stimulating factor 3 17 5.22 -1.540
t P.Value adj.P.Val
CCDC3 5.83 8.50e-07 0.00859
C4orf54 5.69 1.31e-06 0.00859
CSNK1G2 5.65 1.42e-06 0.00859
JRKL -5.33 3.75e-06 0.01701
ERICH6-AS1 -5.25 4.72e-06 0.01713
C5orf34 -5.14 6.45e-06 0.01949
LYSMD1 -5.05 8.36e-06 0.02167
ATAD3C 4.92 1.20e-05 0.02714
OR51E1 -4.82 1.68e-05 0.03385
CSF3 4.77 1.99e-05 0.03614Interaction of sex differences between DCM and Fetal
topTreat(treat.endo,coef=7)[,-c(1:3)] GENENAME
APOA2 apolipoprotein A2
JRKL JRK like
TTLL2 tubulin tyrosine ligase like 2
ELFN2 extracellular leucine rich repeat and fibronectin type III domain containing 2
GPHA2 glycoprotein hormone subunit alpha 2
SLC6A2 solute carrier family 6 member 2
MGMT O-6-methylguanine-DNA methyltransferase
C4orf54 chromosome 4 open reading frame 54
C5orf34 chromosome 5 open reading frame 34
BMP10 bone morphogenetic protein 10
CHR logFC AveExpr t P.Value adj.P.Val
APOA2 1 4.00 -2.107 5.00 9.86e-06 0.179
JRKL 11 -5.19 3.031 -4.65 2.82e-05 0.221
TTLL2 6 -5.99 -0.373 -4.48 4.78e-05 0.221
ELFN2 22 -5.39 -0.306 -4.40 5.81e-05 0.221
GPHA2 11 3.99 -2.139 4.37 6.09e-05 0.221
SLC6A2 16 4.86 -1.045 4.28 8.25e-05 0.229
MGMT 10 -2.55 6.986 -4.24 8.82e-05 0.229
C4orf54 4 7.26 -1.023 4.14 1.34e-04 0.241
C5orf34 5 -4.27 2.415 -4.10 1.36e-04 0.241
BMP10 2 4.75 -1.817 4.08 1.44e-04 0.241Interaction of sex differences between ND and Fetal
topTreat(treat.endo,coef=8)[,-c(1:3)] GENENAME CHR logFC AveExpr t
UMODL1 uromodulin like 1 21 9.32 -0.516 4.88
APOA2 apolipoprotein A2 1 3.57 -2.107 4.23
ADGRA1 adhesion G protein-coupled receptor A1 10 4.77 -1.663 4.21
SMAD1-AS1 SMAD1 antisense RNA 1 4 -5.22 -1.296 -3.97
PRG4 proteoglycan 4 1 6.56 0.266 3.88
C16orf78 chromosome 16 open reading frame 78 16 4.62 -0.497 3.84
GPHA2 glycoprotein hormone subunit alpha 2 11 3.57 -2.139 3.72
NCBP2-AS1 NCBP2 antisense RNA 1 3 -6.16 0.340 -3.75
OPN5 opsin 5 6 5.42 -0.377 3.62
ALB albumin 4 5.08 -1.191 3.57
P.Value adj.P.Val
UMODL1 1.63e-05 0.296
APOA2 9.00e-05 0.605
ADGRA1 1.00e-04 0.605
SMAD1-AS1 2.01e-04 0.879
PRG4 2.78e-04 0.879
C16orf78 2.91e-04 0.879
GPHA2 3.91e-04 0.911
NCBP2-AS1 4.02e-04 0.911
OPN5 5.58e-04 1.000
ALB 6.24e-04 1.000Interaction of sex differences between DCM and ND
topTreat(treat.endo,coef=9)[,-c(1:3)] GENENAME CHR logFC AveExpr
CCDC3 coiled-coil domain containing 3 10 4.37 5.334
NKAIN2 sodium/potassium transporting ATPase interacting 2 6 6.20 4.799
BMPR1A bone morphogenetic protein receptor type 1A 10 3.24 8.038
ADAD2 adenosine deaminase domain containing 2 16 -6.78 -1.739
ATAD3C ATPase family AAA domain containing 3C 1 4.18 1.401
LINC02316 long intergenic non-protein coding RNA 2316 14 -6.31 0.184
JRKL JRK like 11 -5.19 3.031
C16orf78 chromosome 16 open reading frame 78 16 -5.14 -0.497
CAVIN2 caveolae associated protein 2 2 -4.03 3.671
SMIM28 small integral membrane protein 28 6 5.75 -1.501
t P.Value adj.P.Val
CCDC3 5.93 6.36e-07 0.0115
NKAIN2 5.68 1.36e-06 0.0124
BMPR1A 5.20 5.36e-06 0.0324
ADAD2 -5.07 8.64e-06 0.0392
ATAD3C 4.54 3.76e-05 0.1365
LINC02316 -4.49 4.70e-05 0.1422
JRKL -4.28 8.35e-05 0.2165
C16orf78 -4.14 1.25e-04 0.2838
CAVIN2 -4.03 1.65e-04 0.3108
SMIM28 3.98 2.03e-04 0.3108par(mar=c(5,5,3,2))
plot(treat.endo$coefficients[,1],treat.endo$coefficients[,2],xlab="logFC: ND vs Fetal", ylab="logFC: DCM vs Fetal",main="endothelial cells",col=rgb(0,0,1,alpha=0.25),pch=16,cex=0.8)
abline(h=0,v=0,col=colours()[c(175)])
sig.genes <- dt.endo[,1] !=0 | dt.endo[,2] != 0
text(treat.endo$coefficients[sig.genes,1],treat.endo$coefficients[sig.genes,2],labels=rownames(dt.endo)[sig.genes],col=2,cex=0.6)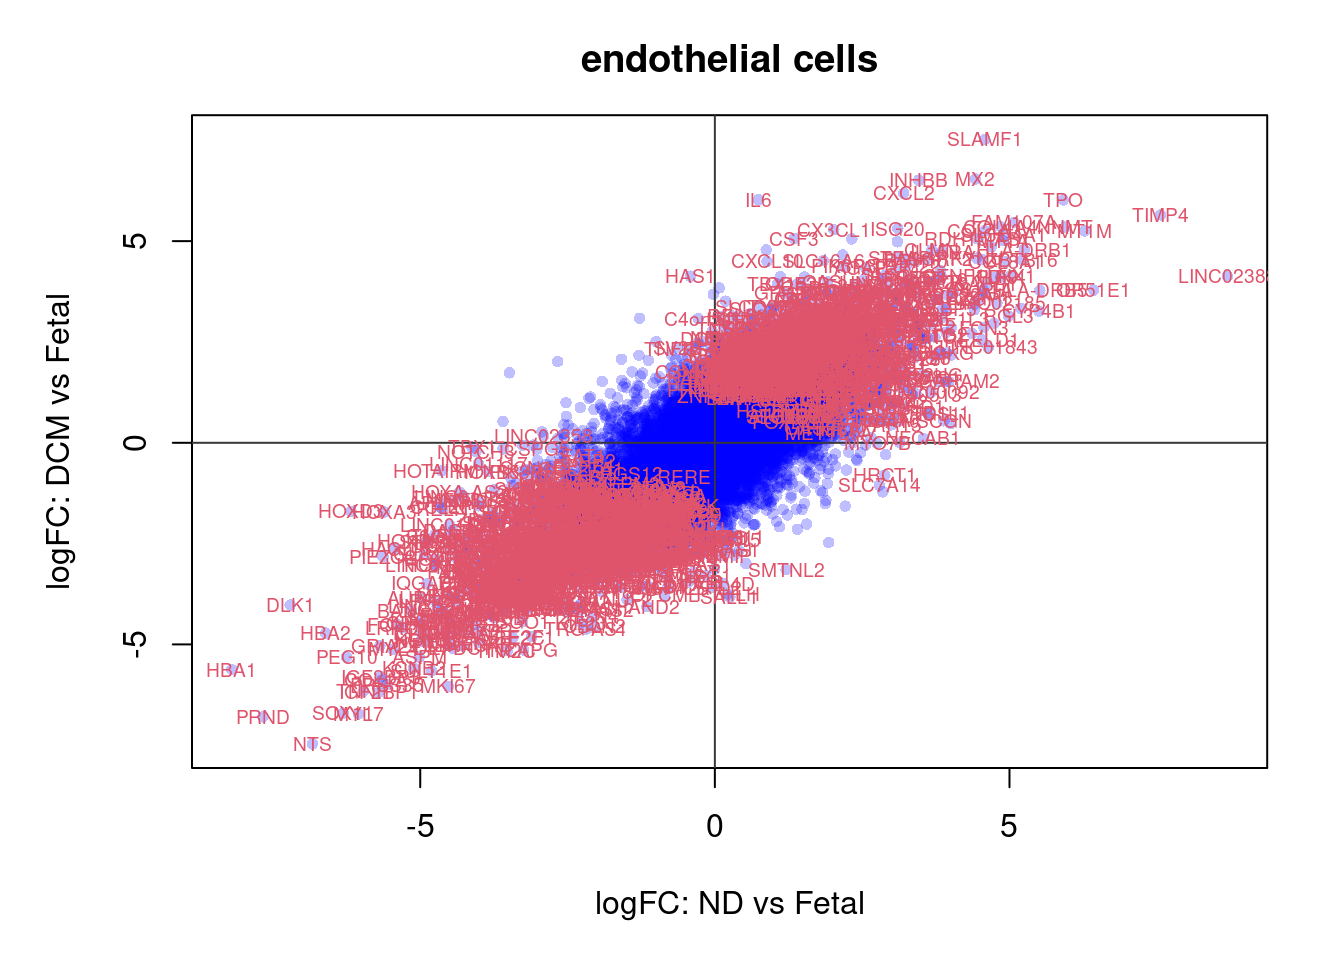
par(mar=c(5,5,3,2))
plot(treat.endo$coefficients[,4],treat.endo$coefficients[,5],xlab="logFC: Fetal Male vs Female", ylab="logFC: ND Male vs Female",main="endothelial cells: Sex differences - Fetal and ND",col=rgb(0,0,1,alpha=0.25),pch=16,cex=0.8)
abline(h=0,v=0)
sig.genes <- dt.endo[,4] !=0 | dt.endo[,5] != 0
text(treat.endo$coefficients[sig.genes,4],treat.endo$coefficients[sig.genes,5],labels=rownames(dt.endo)[sig.genes],col=2,cex=0.6)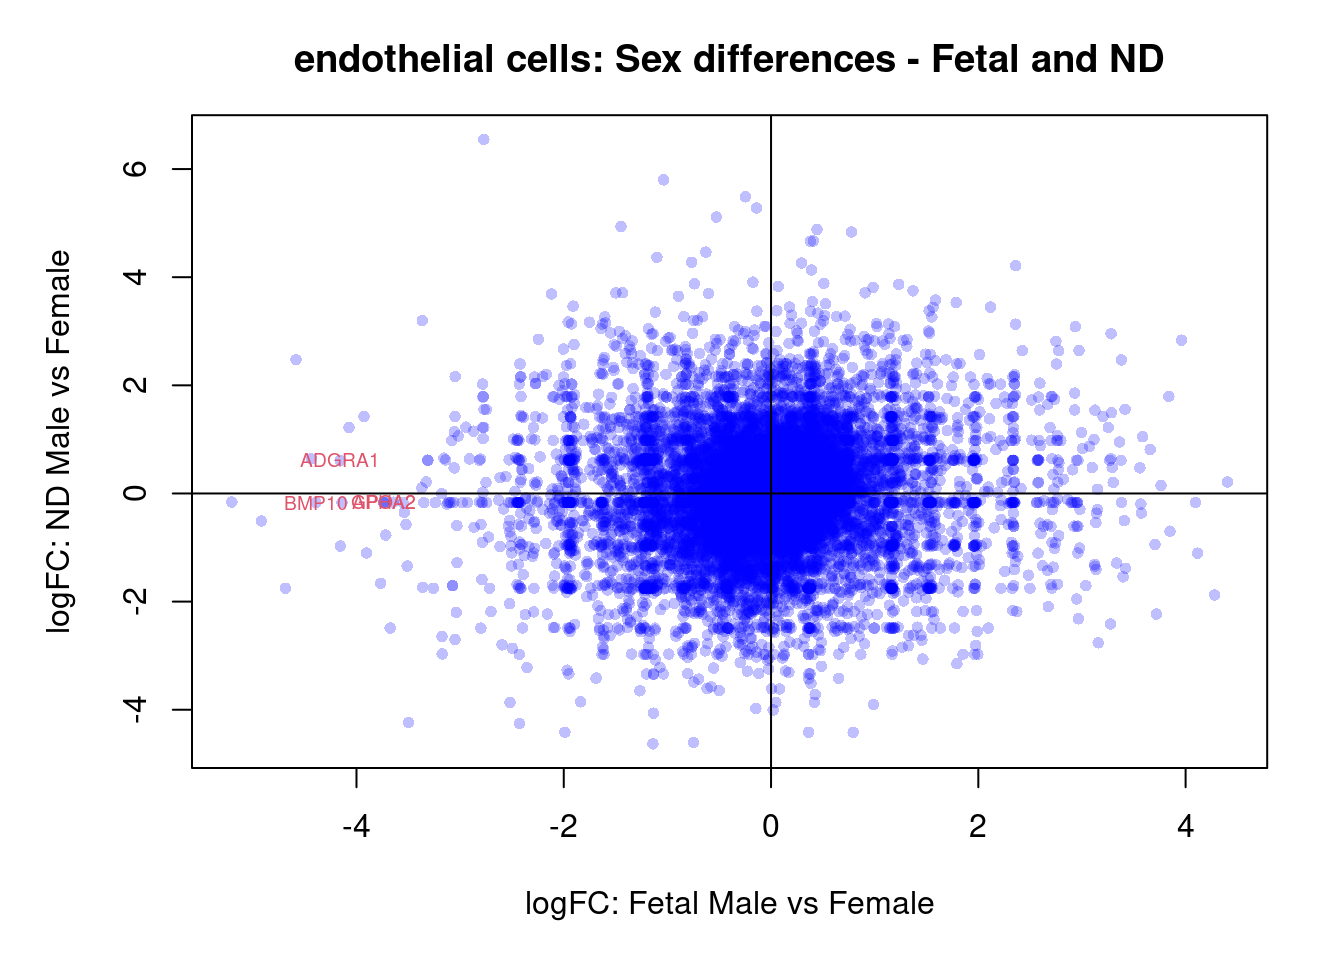
par(mar=c(5,5,3,2))
plot(treat.endo$coefficients[,4],treat.endo$coefficients[,6],xlab="logFC: Fetal Male vs Female", ylab="logFC: DCM Male vs Female",main="endothelial cells: Sex differences - Fetal and DCM",col=rgb(0,0,1,alpha=0.25),pch=16,cex=0.8)
abline(h=0,v=0)
sig.genes <- dt.endo[,4] !=0 | dt.endo[,6] != 0
text(treat.endo$coefficients[sig.genes,4],treat.endo$coefficients[sig.genes,6],labels=rownames(dt.endo)[sig.genes],col=2,cex=0.6)
par(mar=c(5,5,3,2))
plot(treat.endo$coefficients[,5],treat.endo$coefficients[,6],xlab="logFC: ND Male vs Female", ylab="logFC: DCM Male vs Female",main="endothelial cells: Sex differences - ND and DCM",col=rgb(0,0,1,alpha=0.25),pch=16,cex=0.8)
sig.genes <- dt.endo[,5] !=0 | dt.endo[,6] != 0
text(treat.endo$coefficients[sig.genes,5],treat.endo$coefficients[sig.genes,6],labels=rownames(dt.endo)[sig.genes],col=2,cex=0.6)
abline(h=0,v=0)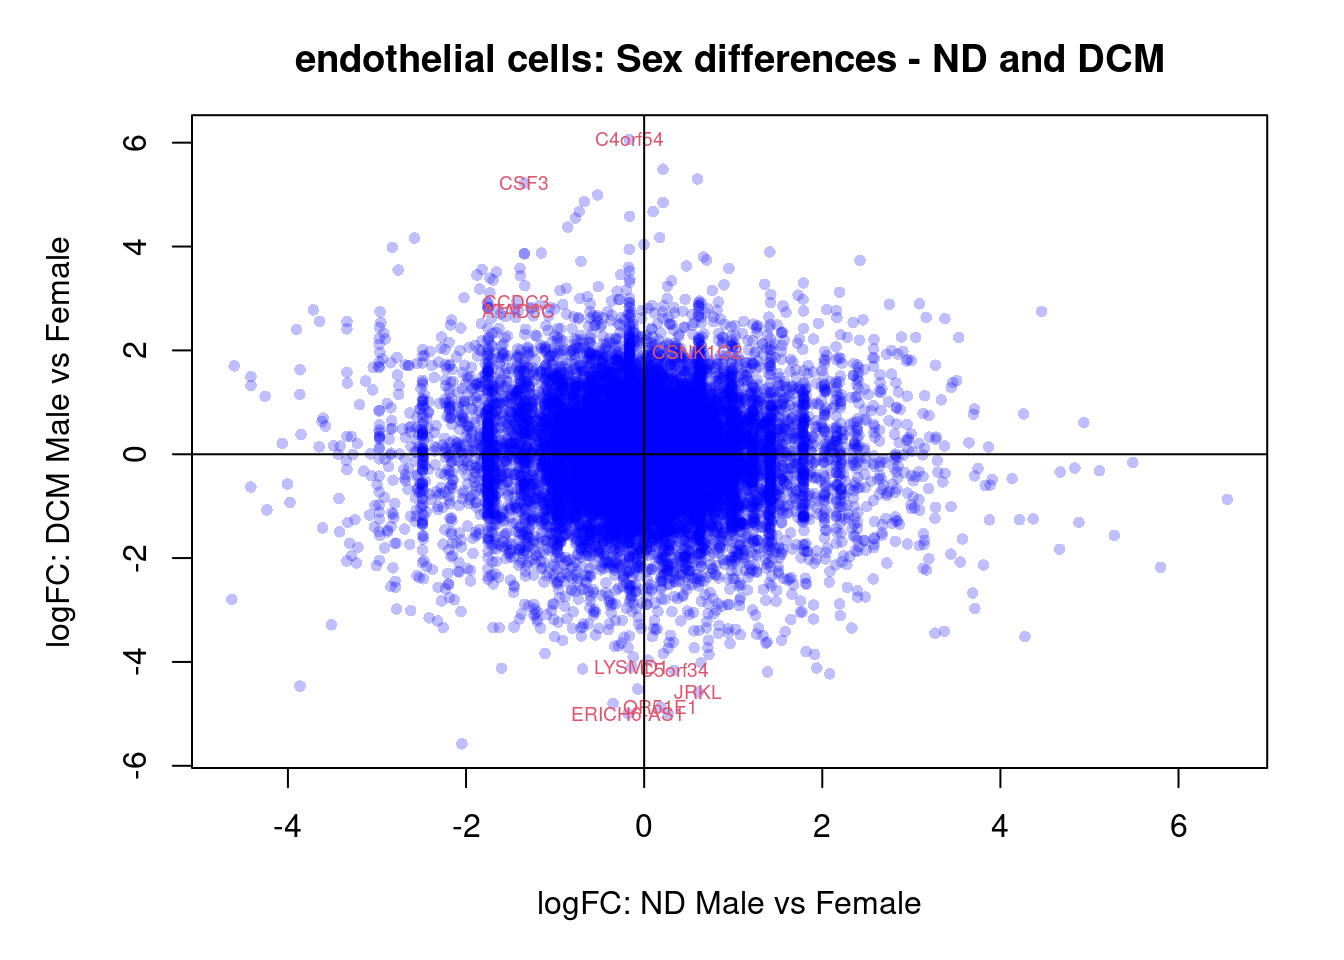
par(mar=c(5,5,3,2))
plot(treat.endo$coefficients[,4],treat.endo$coefficients[,5],xlab="logFC: Fetal Male vs Female", ylab="logFC: ND Male vs Female",main="endothelial cells: Interaction term: Fetal vs ND",col=rgb(0,0,1,alpha=0.25),pch=16,cex=0.8)
abline(h=0,v=0)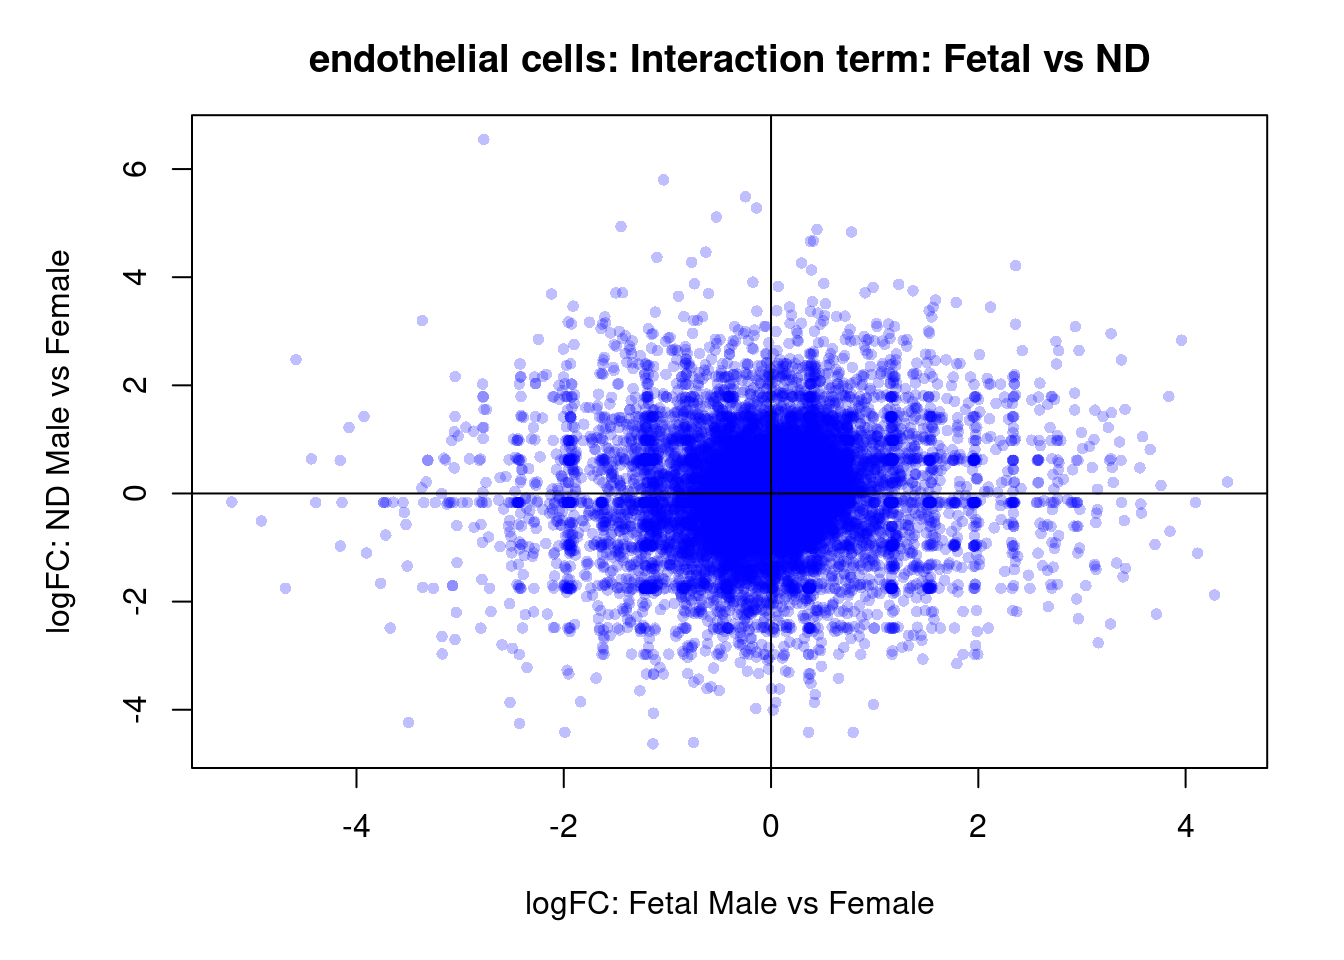
sig.genes <- dt.endo[,8] !=0
if(length(rownames(dt.endo)[sig.genes]) !=0)
text(treat.endo$coefficients[sig.genes,4],treat.endo$coefficients[sig.genes,5],labels=rownames(dt.endo)[sig.genes],col=2,cex=0.6)
par(mar=c(5,5,3,2))
plot(treat.endo$coefficients[,4],treat.endo$coefficients[,6],xlab="logFC: Fetal Male vs Female", ylab="logFC: DCM Male vs Female",main="endothelial cells: Interaction term: Fetal and DCM",col=rgb(0,0,1,alpha=0.25),pch=16,cex=0.8)
abline(h=0,v=0)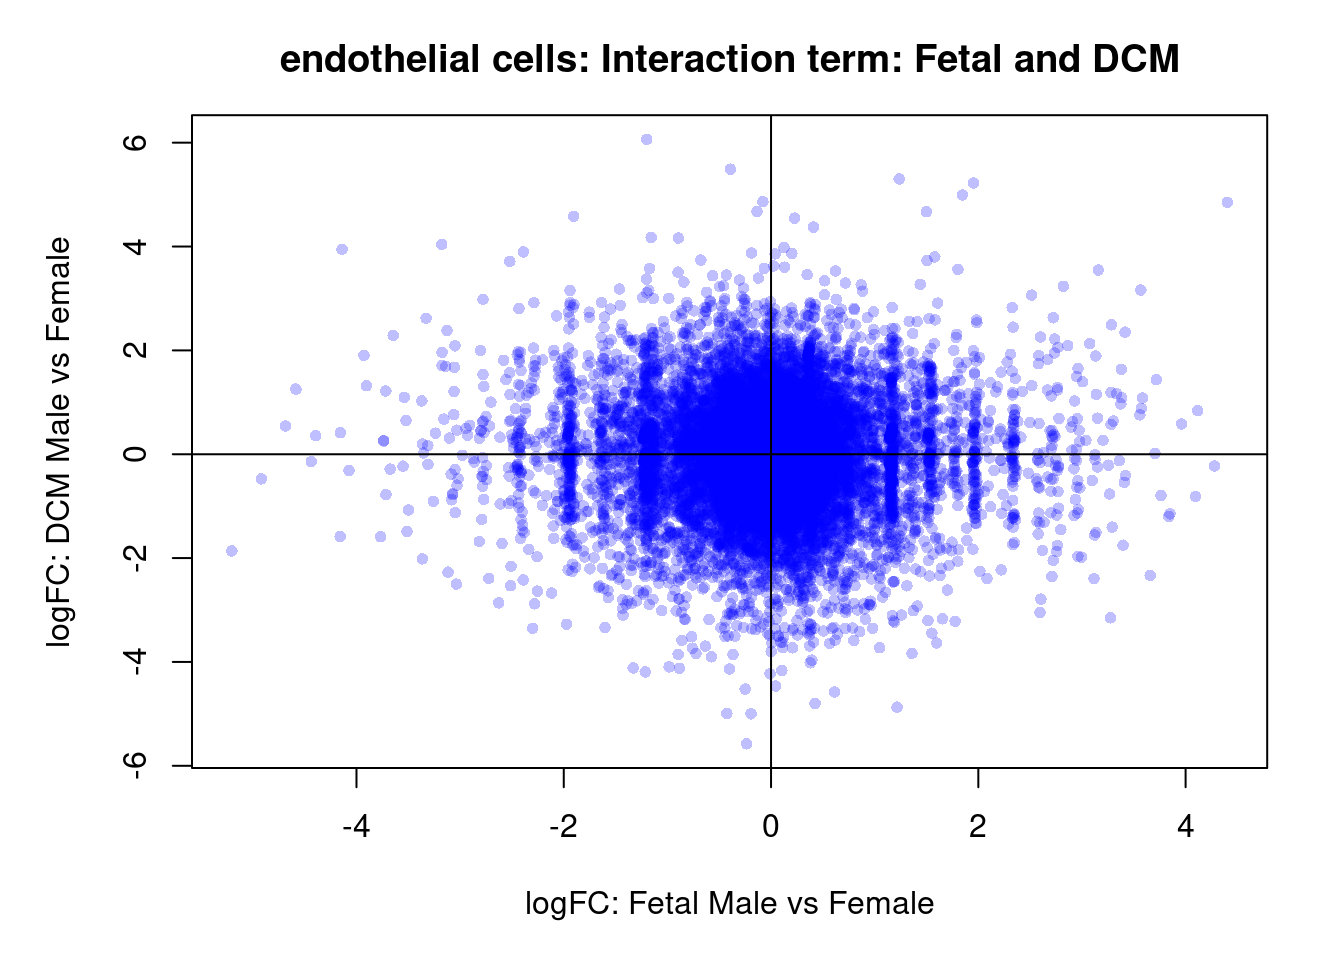
sig.genes <- dt.endo[,7] !=0
if(length(rownames(dt.endo)[sig.genes]) !=0)
text(treat.endo$coefficients[sig.genes,4],treat.endo$coefficients[sig.genes,6],labels=rownames(dt.endo)[sig.genes],col=2,cex=0.6)
par(mar=c(5,5,3,2))
plot(treat.endo$coefficients[,5],treat.endo$coefficients[,6],xlab="logFC: ND Male vs Female", ylab="logFC: DCM Male vs Female",main="endothelial cells: Interaction term: ND and DCM",col=rgb(0,0,1,alpha=0.25),pch=16,cex=0.8)
abline(h=0,v=0)
sig.genes <- dt.endo[,9] !=0
if(length(rownames(dt.endo)[sig.genes]) !=0)
text(treat.endo$coefficients[sig.genes,5],treat.endo$coefficients[sig.genes,6],labels=rownames(dt.endo)[sig.genes],col=2,cex=0.6)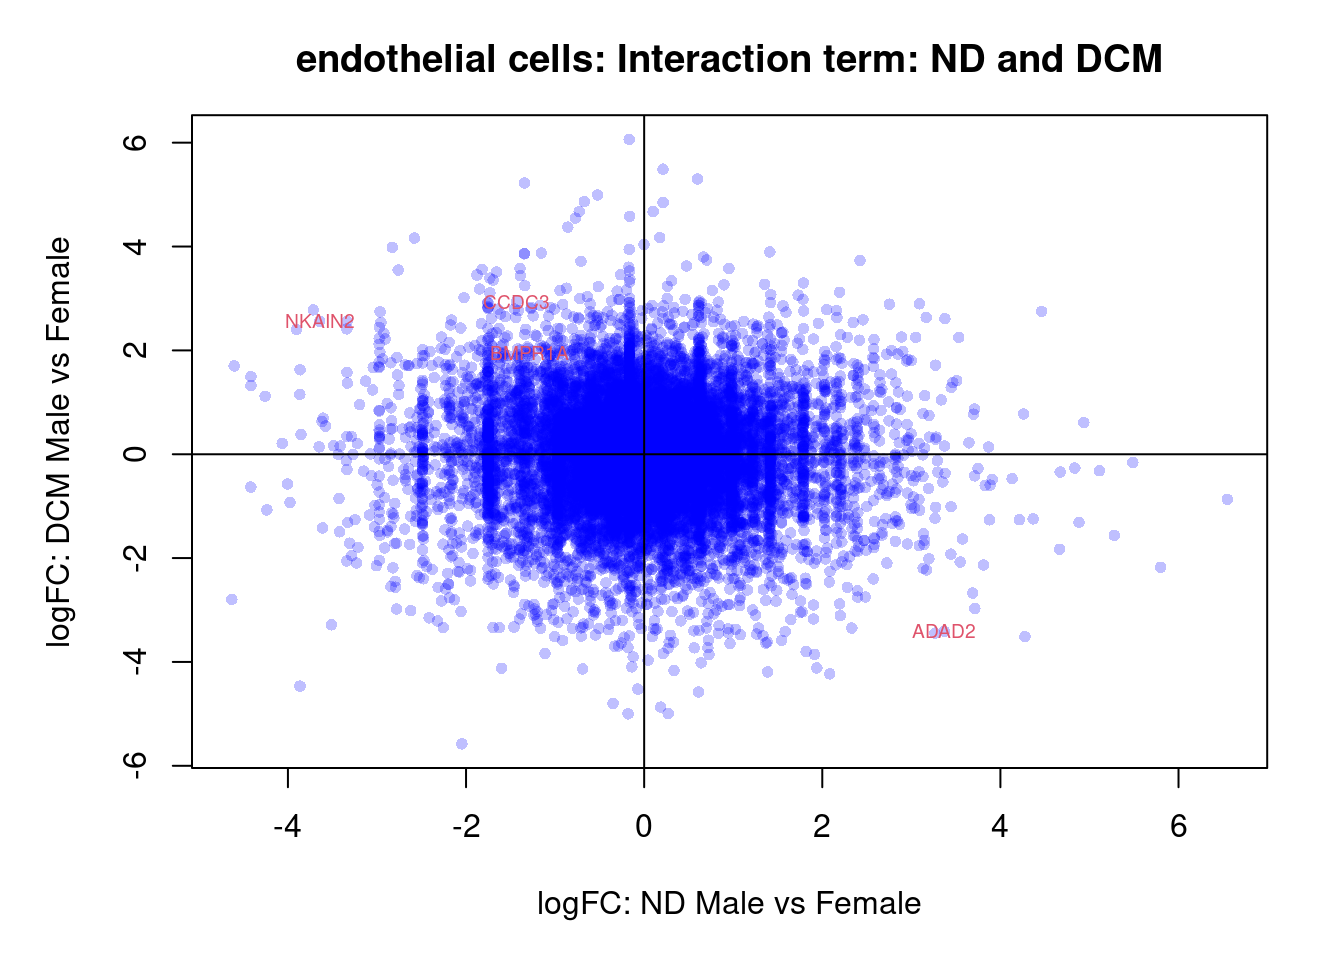
Immune cells
cont.immune <- makeContrasts(NvF = 0.5*(immune.ND.Male + immune.ND.Female) - 0.5*(immune.Fetal.Male + immune.Fetal.Female),
                         DvF = 0.5*(immune.DCM.Male + immune.DCM.Female) - 0.5*(immune.Fetal.Male + immune.Fetal.Female),
                         DvN = 0.5*(immune.DCM.Male + immune.DCM.Female) - 0.5*(immune.ND.Male + immune.ND.Female),
                         SexFetal = immune.Fetal.Male - immune.Fetal.Female,
                         SexND = immune.ND.Male - immune.ND.Female,
                         SexDCM = immune.DCM.Male - immune.DCM.Female,
                         InteractionDF = (immune.DCM.Male - immune.Fetal.Male) - (immune.DCM.Female - immune.Fetal.Female),
                         InteractionNF = (immune.ND.Male - immune.Fetal.Male) - (immune.ND.Female - immune.Fetal.Female),
                         InteractionDN = (immune.DCM.Male - immune.ND.Male) - (immune.DCM.Female - immune.ND.Female),
                         levels=design)
fit.immune <- contrasts.fit(fit,contrasts = cont.immune)
fit.immune <- eBayes(fit.immune,robust=TRUE)

summary(decideTests(fit.immune))
NvF DvF DvN SexFetal SexND SexDCM InteractionDF InteractionNF
Down 293 305 233 0 15 56 2 0
NotSig 17584 17549 17805 18141 18124 18054 18139 18141
Up 264 287 103 0 2 31 0 0
InteractionDN
Down 7
NotSig 18131
Up 3treat.immune <- treat(fit.immune,lfc=0.5)
dt.immune<-decideTests(treat.immune)
summary(dt.immune) NvF DvF DvN SexFetal SexND SexDCM InteractionDF InteractionNF
Down 111 76 41 0 1 13 0 0
NotSig 17953 18024 18097 18141 18140 18122 18141 18141
Up 77 41 3 0 0 6 0 0
InteractionDN
Down 0
NotSig 18140
Up 1par(mfrow=c(3,3))
for(i in 1:9){
plotMD(treat.immune,coef=i,status=dt.immune[,i],hl.col=c("blue","red"))
abline(h=0,col="grey")
}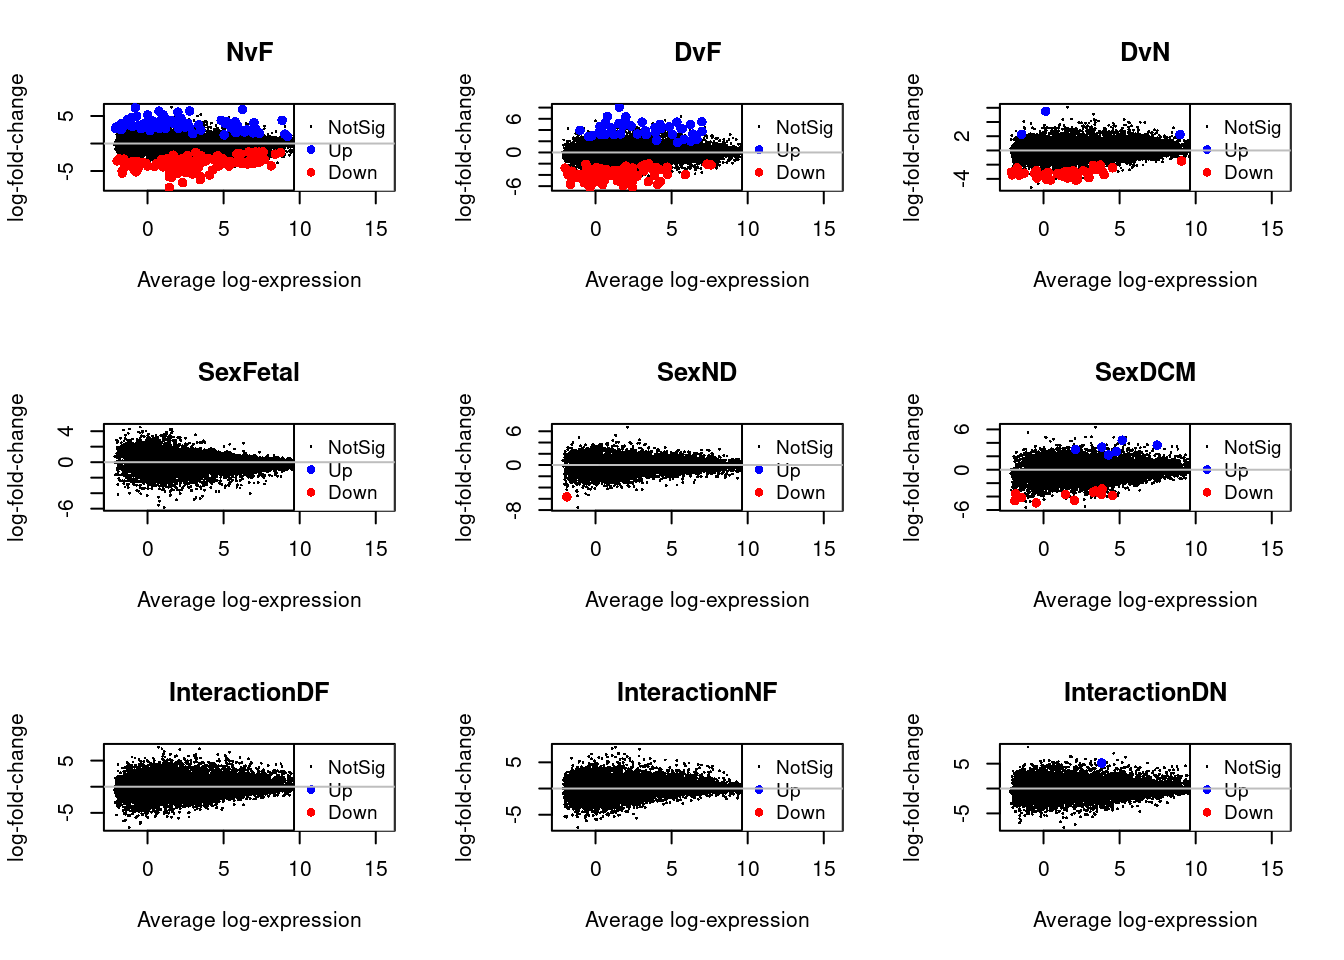
par(mfrow=c(1,1))
par(mar=c(7,4,2,2))
barplot(summary(dt.immune)[-2,],beside=TRUE,legend=TRUE,col=c("blue","red"),ylab="Number of significant genes",las=2)
title("Immune cells")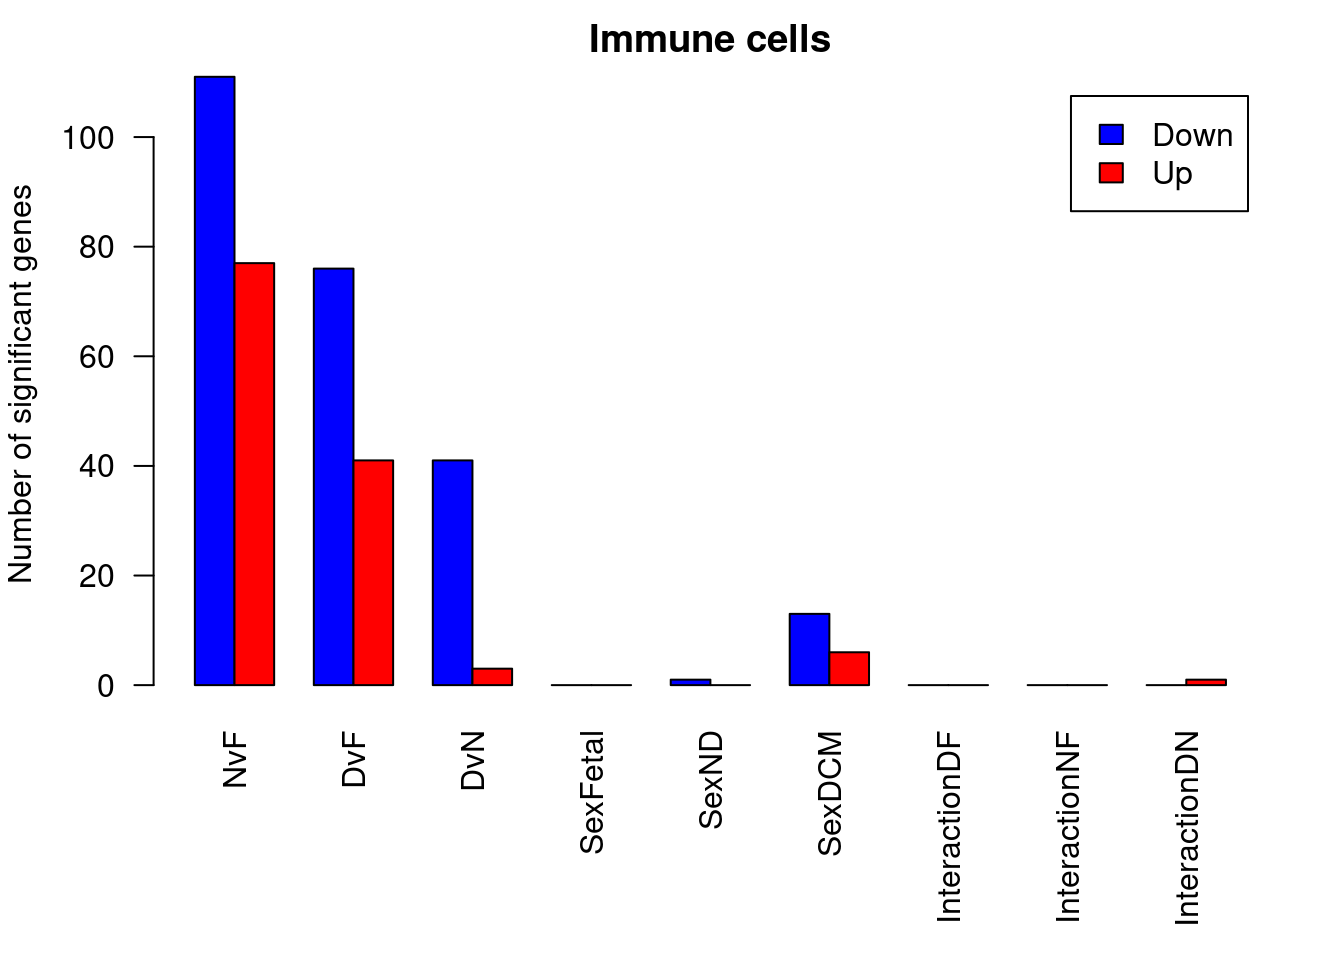
ND vs Fetal
options(digits=3)
topTreat(treat.immune,coef=1,n=20,p.value=0.05)[,-c(1:3)]
GENENAME CHR logFC AveExpr
IGF2BP3 insulin like growth factor 2 mRNA binding protein 3 7 -4.85 4.2625
IGF2BP1 insulin like growth factor 2 mRNA binding protein 1 17 -6.03 1.4304
HBA1 hemoglobin subunit alpha 1 16 -8.00 1.4280
LINC02513 long intergenic non-protein coding RNA 2513 4 -5.40 -1.6603
MSLN mesothelin 16 -4.97 -1.6690
MMP15 matrix metallopeptidase 15 16 -5.19 2.5922
DLK1 delta like non-canonical Notch ligand 1 14 -6.13 1.5811
NPPA natriuretic peptide A 1 -3.97 4.7417
HBA2 hemoglobin subunit alpha 2 16 -7.12 2.3080
FRMD5 FERM domain containing 5 15 -3.48 5.8962
LINC01127 long intergenic non-protein coding RNA 1127 2 3.57 -1.7359
SAP30 Sin3A associated protein 30 4 3.39 3.3640
FGL1 fibrinogen like 1 8 -3.59 -0.1266
PRSS35 serine protease 35 6 -4.01 1.2339
FBXL7 F-box and leucine rich repeat protein 7 5 -2.75 10.1340
LINC00968 long intergenic non-protein coding RNA 968 8 4.14 1.5733
MYL7 myosin light chain 7 7 -5.71 4.0768
NAV3 neuron navigator 3 12 -2.89 7.6696
CX3CR1 C-X3-C motif chemokine receptor 1 3 -4.09 0.0129
LINC02621 long intergenic non-protein coding RNA 2621 10 3.84 -1.1386
t P.Value adj.P.Val
IGF2BP3 -10.07 8.20e-12 1.49e-07
IGF2BP1 -8.31 7.85e-10 7.12e-06
HBA1 -7.90 2.44e-09 1.48e-05
LINC02513 -7.71 3.95e-09 1.79e-05
MSLN -6.92 3.60e-08 1.31e-04
MMP15 -6.42 1.54e-07 4.06e-04
DLK1 -6.42 1.57e-07 4.06e-04
NPPA -6.32 2.04e-07 4.42e-04
HBA2 -6.31 2.19e-07 4.42e-04
FRMD5 -6.07 4.16e-07 6.06e-04
LINC01127 6.07 4.24e-07 6.06e-04
SAP30 6.06 4.32e-07 6.06e-04
FGL1 -6.06 4.34e-07 6.06e-04
PRSS35 -6.02 4.92e-07 6.37e-04
FBXL7 -5.98 5.41e-07 6.39e-04
LINC00968 5.97 5.63e-07 6.39e-04
MYL7 -5.81 9.23e-07 9.85e-04
NAV3 -5.74 1.11e-06 1.12e-03
CX3CR1 -5.70 1.25e-06 1.18e-03
LINC02621 5.67 1.36e-06 1.18e-03DCM vs Fetal
topTreat(treat.immune,coef=2,n=20,p.value=0.05)[,-c(1:3)] GENENAME CHR logFC AveExpr
LINC02513 long intergenic non-protein coding RNA 2513 4 -5.69 -1.6603
IGF2BP3 insulin like growth factor 2 mRNA binding protein 3 7 -5.18 4.2625
FGL1 fibrinogen like 1 8 -4.46 -0.1266
CPA3 carboxypeptidase A3 3 -5.75 0.4617
IGF2BP1 insulin like growth factor 2 mRNA binding protein 1 17 -5.05 1.4304
CX3CR1 C-X3-C motif chemokine receptor 1 3 -5.22 0.0129
SIGLEC6 sialic acid binding Ig like lectin 6 19 -4.45 -1.2667
PRSS35 serine protease 35 6 -3.92 1.2339
LINC01478 long intergenic non-protein coding RNA 1478 18 -5.00 0.5891
TPSAB1 tryptase alpha/beta 1 16 -6.25 -0.3565
MS4A2 membrane spanning 4-domains A2 11 -5.27 -0.4253
MSLN mesothelin 16 -4.16 -1.6690
SFMBT2 Scm like with four mbt domains 2 10 -2.08 7.3279
IGHM immunoglobulin heavy constant mu 14 -4.40 -0.8645
HDC histidine decarboxylase 15 -5.06 0.2846
TNNI1 troponin I1, slow skeletal type 1 -6.23 2.4286
SMIM35 small integral membrane protein 35 11 -5.21 1.9819
SGMS2 sphingomyelin synthase 2 4 4.55 4.8398
SEMA7A semaphorin 7A (John Milton Hagen blood group) 15 -2.96 0.3886
LINC01605 long intergenic non-protein coding RNA 1605 8 -3.82 1.6391
t P.Value adj.P.Val
LINC02513 -8.74 2.42e-10 4.40e-06
IGF2BP3 -8.43 5.52e-10 5.01e-06
FGL1 -7.84 2.76e-09 1.67e-05
CPA3 -7.42 8.89e-09 3.24e-05
IGF2BP1 -7.38 9.95e-09 3.24e-05
CX3CR1 -7.35 1.07e-08 3.24e-05
SIGLEC6 -6.63 8.32e-08 2.16e-04
PRSS35 -6.24 2.56e-07 5.80e-04
LINC01478 -6.10 3.93e-07 7.92e-04
TPSAB1 -6.01 5.15e-07 8.86e-04
MS4A2 -5.99 5.37e-07 8.86e-04
MSLN -5.84 8.35e-07 1.26e-03
SFMBT2 -5.79 9.39e-07 1.31e-03
IGHM -5.72 1.18e-06 1.53e-03
HDC -5.68 1.32e-06 1.60e-03
TNNI1 -5.67 1.43e-06 1.62e-03
SMIM35 -5.57 1.85e-06 1.98e-03
SGMS2 5.48 2.43e-06 2.32e-03
SEMA7A -5.46 2.50e-06 2.32e-03
LINC01605 -5.45 2.57e-06 2.32e-03DCM vs ND
topTreat(treat.immune,coef=3)[,-c(1:3)] GENENAME CHR logFC AveExpr t
CCDC40 coiled-coil domain containing 40 17 -3.42 3.985 -7.43
SPATA8-AS1 SPATA8 antisense RNA 1 (head to head) 15 -3.43 -2.053 -6.72
CEP55 centrosomal protein 55 10 -3.67 1.344 -6.17
SIGLEC10 sialic acid binding Ig like lectin 10 19 -3.88 -0.428 -6.02
GTSE1 G2 and S-phase expressed 1 22 -4.17 2.121 -5.91
FANCI FA complementation group I 15 -2.96 3.862 -5.65
NCAPG non-SMC condensin I complex subunit G 4 -3.87 1.576 -5.48
FOXM1 forkhead box M1 12 -3.35 1.818 -5.26
SAP30 Sin3A associated protein 30 4 -2.71 3.364 -5.19
CPA3 carboxypeptidase A3 3 -4.17 0.462 -5.05
P.Value adj.P.Val
CCDC40 8.61e-09 0.000156
SPATA8-AS1 6.44e-08 0.000584
CEP55 3.17e-07 0.001918
SIGLEC10 4.90e-07 0.002223
GTSE1 6.75e-07 0.002448
FANCI 1.42e-06 0.004303
NCAPG 2.37e-06 0.006136
FOXM1 4.45e-06 0.010090
SAP30 5.52e-06 0.011124
CPA3 8.43e-06 0.015290Male vs Female in Fetal samples
topTreat(treat.immune,coef=4)[,-c(1:3)] GENENAME CHR logFC AveExpr
MT1H metallothionein 1H 16 -4.14 -1.9453
MOCOS molybdenum cofactor sulfurase 18 -4.05 2.1568
SLC6A1-AS1 SLC6A1 antisense RNA 1 3 -4.86 1.9098
PRDM6 PR/SET domain 6 5 -4.69 3.4719
HNRNPUL2-BSCL2 HNRNPUL2-BSCL2 readthrough (NMD candidate) 11 -3.40 0.2831
PLET1 placenta expressed transcript 1 11 4.21 1.4954
HEMGN hemogen 9 -3.34 -0.4707
ZNF541 zinc finger protein 541 19 3.42 0.5619
ALB albumin 4 -4.02 -1.1914
LINC01538 long intergenic non-protein coding RNA 1538 18 -3.02 0.0519
t P.Value adj.P.Val
MT1H -4.65 2.70e-05 0.489
MOCOS -4.27 8.18e-05 0.653
SLC6A1-AS1 -4.07 1.49e-04 0.653
PRDM6 -4.04 1.61e-04 0.653
HNRNPUL2-BSCL2 -3.99 1.80e-04 0.653
PLET1 3.59 5.66e-04 1.000
HEMGN -3.57 5.88e-04 1.000
ZNF541 3.49 7.32e-04 1.000
ALB -3.47 7.82e-04 1.000
LINC01538 -3.46 7.91e-04 1.000Male vs Female in ND samples
topTreat(treat.immune,coef=5)[,-c(1:3)] GENENAME CHR logFC AveExpr
LINC01839 long intergenic non-protein coding RNA 1839 3 -5.66 -1.89
SPATA8-AS1 SPATA8 antisense RNA 1 (head to head) 15 -3.40 -2.05
GTSE1 G2 and S-phase expressed 1 22 -3.67 2.12
SIX5 SIX homeobox 5 19 3.99 2.25
STIL STIL centriolar assembly protein 1 -2.67 2.88
IGHG3 immunoglobulin heavy constant gamma 3 (G3m marker) 14 -7.55 -1.17
LINC01416 long intergenic non-protein coding RNA 1416 18 5.26 1.32
SPC24 SPC24 component of NDC80 kinetochore complex 19 -2.90 1.93
KIF14 kinesin family member 14 1 -3.04 2.00
NCAPH non-SMC condensin I complex subunit H 2 -3.26 1.40
t P.Value adj.P.Val
LINC01839 -8.01 1.75e-09 3.17e-05
SPATA8-AS1 -5.06 8.18e-06 7.42e-02
GTSE1 -4.88 1.36e-05 8.23e-02
SIX5 4.62 2.96e-05 1.34e-01
STIL -4.53 3.72e-05 1.35e-01
IGHG3 -4.48 5.02e-05 1.43e-01
LINC01416 4.38 6.13e-05 1.43e-01
SPC24 -4.31 7.08e-05 1.43e-01
KIF14 -4.31 7.11e-05 1.43e-01
NCAPH -4.22 9.29e-05 1.69e-01Male vs Female in DCM samples
topTreat(treat.immune,coef=6)[,-c(1:3)] GENENAME CHR logFC
RPUSD3 RNA pseudouridine synthase D3 3 -3.30
VPS9D1 VPS9 domain containing 1 16 2.69
LINC01839 long intergenic non-protein coding RNA 1839 3 -4.62
TRABD TraB domain containing 22 2.20
APOBEC3G apolipoprotein B mRNA editing enzyme catalytic subunit 3G 22 -4.55
FAM200B family with sequence similarity 200 member B 4 -3.42
SLC46A1 solute carrier family 46 member 1 17 -3.70
AKIP1 A-kinase interacting protein 1 11 -3.35
MEX3C mex-3 RNA binding family member C 18 -3.68
LMNB1 lamin B1 5 3.36
AveExpr t P.Value adj.P.Val
RPUSD3 3.49 -6.01 5.01e-07 0.00664
VPS9D1 4.79 5.81 8.90e-07 0.00664
LINC01839 -1.89 -5.69 1.29e-06 0.00664
TRABD 4.26 5.64 1.46e-06 0.00664
APOBEC3G 2.03 -5.47 2.50e-06 0.00907
FAM200B 3.73 -5.36 3.36e-06 0.01015
SLC46A1 1.44 -5.14 6.48e-06 0.01680
AKIP1 3.27 -4.99 9.96e-06 0.02031
MEX3C 3.82 -4.99 1.01e-05 0.02031
LMNB1 3.83 4.90 1.29e-05 0.02167Interaction of sex differences between DCM and Fetal
topTreat(treat.immune,coef=7)[,-c(1:3)] GENENAME CHR logFC
APOBEC3G apolipoprotein B mRNA editing enzyme catalytic subunit 3G 22 -6.04
RPUSD3 RNA pseudouridine synthase D3 3 -3.69
SLC46A1 solute carrier family 46 member 1 17 -4.42
CLDN7 claudin 7 17 -6.77
CD180 CD180 molecule 5 -4.12
TMEM254 transmembrane protein 254 10 -4.36
SIGLEC11 sialic acid binding Ig like lectin 11 19 -5.43
CX3CR1 C-X3-C motif chemokine receptor 1 3 -5.86
SUCNR1 succinate receptor 1 3 -7.81
TREML1 triggering receptor expressed on myeloid cells like 1 6 -5.24
AveExpr t P.Value adj.P.Val
APOBEC3G 2.0293 -5.16 6.40e-06 0.116
RPUSD3 3.4928 -4.86 1.44e-05 0.131
SLC46A1 1.4436 -4.42 5.32e-05 0.266
CLDN7 -0.4782 -4.32 7.74e-05 0.266
CD180 -0.6317 -4.24 9.03e-05 0.266
TMEM254 3.4798 -4.19 1.05e-04 0.266
SIGLEC11 -2.0202 -4.18 1.12e-04 0.266
CX3CR1 0.0129 -4.17 1.17e-04 0.266
SUCNR1 -1.2011 -4.10 1.55e-04 0.313
TREML1 -1.4635 -4.01 1.84e-04 0.334Interaction of sex differences between ND and Fetal
topTreat(treat.immune,coef=8)[,-c(1:3)] GENENAME CHR logFC AveExpr t
SIX5 SIX homeobox 5 19 5.73 2.2471 4.87
LINC01416 long intergenic non-protein coding RNA 1416 18 7.90 1.3167 4.62
LINC02321 long intergenic non-protein coding RNA 2321 14 4.40 -1.5036 4.14
CSTA cystatin A 3 -5.83 0.0134 -4.08
SIGLEC11 sialic acid binding Ig like lectin 11 19 -5.36 -2.0202 -4.04
SLC6A1-AS1 SLC6A1 antisense RNA 1 3 6.57 1.9098 3.84
CCL13 C-C motif chemokine ligand 13 17 5.79 -1.5642 3.78
LINC02086 long intergenic non-protein coding RNA 2086 17 5.89 0.2156 3.77
E2F2 E2F transcription factor 2 1 -5.86 0.0973 -3.76
NUSAP1 nucleolar and spindle associated protein 1 15 -5.51 -0.6840 -3.73
P.Value adj.P.Val
SIX5 1.51e-05 0.274
LINC01416 3.38e-05 0.307
LINC02321 1.22e-04 0.607
CSTA 1.53e-04 0.607
SIGLEC11 1.67e-04 0.607
SLC6A1-AS1 3.12e-04 0.727
CCL13 3.57e-04 0.727
LINC02086 3.77e-04 0.727
E2F2 3.83e-04 0.727
NUSAP1 4.07e-04 0.727Interaction of sex differences between DCM and ND
topTreat(treat.immune,coef=9)[,-c(1:3)] GENENAME CHR logFC
LMNB1 lamin B1 5 5.12
AKIP1 A-kinase interacting protein 1 11 -4.24
LINC01416 long intergenic non-protein coding RNA 1416 18 -7.85
CCL13 C-C motif chemokine ligand 13 17 -6.91
APOBEC3G apolipoprotein B mRNA editing enzyme catalytic subunit 3G 22 -4.96
RPUSD3 RNA pseudouridine synthase D3 3 -3.29
METRN meteorin, glial cell differentiation regulator 16 -3.62
ANKRA2 ankyrin repeat family A member 2 5 -4.34
TRDC T cell receptor delta constant 14 -6.38
C4orf54 chromosome 4 open reading frame 54 4 8.32
AveExpr t P.Value adj.P.Val
LMNB1 3.83 5.76 1.06e-06 0.0192
AKIP1 3.27 -5.14 6.40e-06 0.0506
LINC01416 1.32 -4.95 1.25e-05 0.0506
CCL13 -1.56 -4.92 1.32e-05 0.0506
APOBEC3G 2.03 -4.88 1.40e-05 0.0506
RPUSD3 3.49 -4.57 3.34e-05 0.1009
METRN 3.85 -4.41 5.39e-05 0.1141
ANKRA2 4.54 -4.40 5.62e-05 0.1141
TRDC -1.48 -4.43 5.66e-05 0.1141
C4orf54 -1.02 4.32 8.21e-05 0.1489par(mar=c(5,5,3,2))
plot(treat.immune$coefficients[,1],treat.immune$coefficients[,2],xlab="logFC: ND vs Fetal", ylab="logFC: DCM vs Fetal",main="immune cells",col=rgb(0,0,1,alpha=0.25),pch=16,cex=0.8)
abline(h=0,v=0,col=colours()[c(175)])
sig.genes <- dt.immune[,1] !=0 | dt.immune[,2] != 0
text(treat.immune$coefficients[sig.genes,1],treat.immune$coefficients[sig.genes,2],labels=rownames(dt.immune)[sig.genes],col=2,cex=0.6)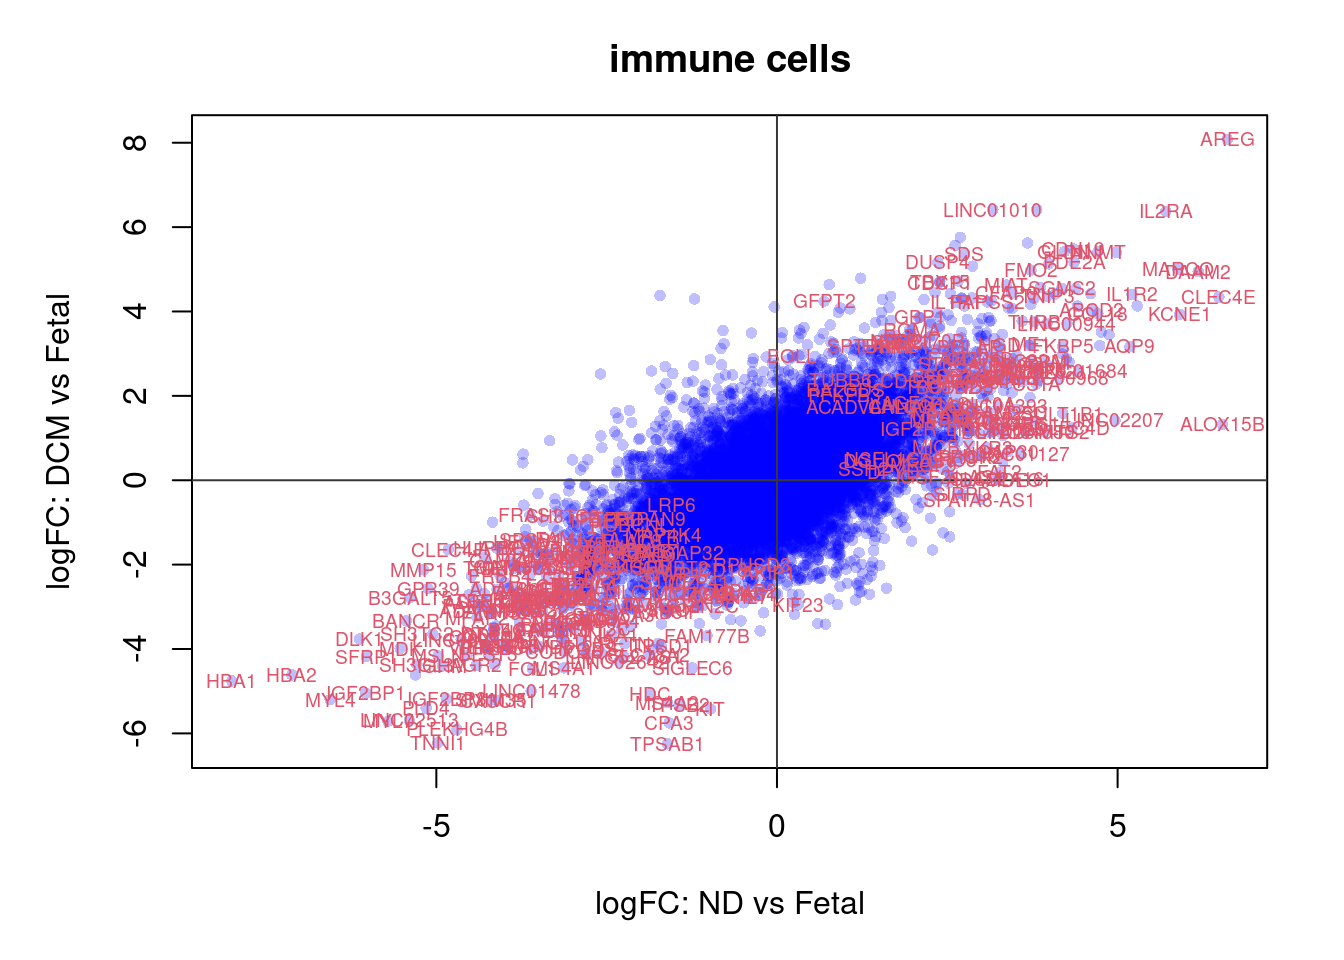
par(mar=c(5,5,3,2))
plot(treat.immune$coefficients[,4],treat.immune$coefficients[,5],xlab="logFC: Fetal Male vs Female", ylab="logFC: ND Male vs Female",main="immune cells: Sex differences - Fetal and ND",col=rgb(0,0,1,alpha=0.25),pch=16,cex=0.8)
abline(h=0,v=0)
sig.genes <- dt.immune[,4] !=0 | dt.immune[,5] != 0
text(treat.immune$coefficients[sig.genes,4],treat.immune$coefficients[sig.genes,5],labels=rownames(dt.immune)[sig.genes],col=2,cex=0.6)
par(mar=c(5,5,3,2))
plot(treat.immune$coefficients[,4],treat.immune$coefficients[,6],xlab="logFC: Fetal Male vs Female", ylab="logFC: DCM Male vs Female",main="immune cells: Sex differences - Fetal and DCM",col=rgb(0,0,1,alpha=0.25),pch=16,cex=0.8)
abline(h=0,v=0)
sig.genes <- dt.immune[,4] !=0 | dt.immune[,6] != 0
text(treat.immune$coefficients[sig.genes,4],treat.immune$coefficients[sig.genes,6],labels=rownames(dt.immune)[sig.genes],col=2,cex=0.6)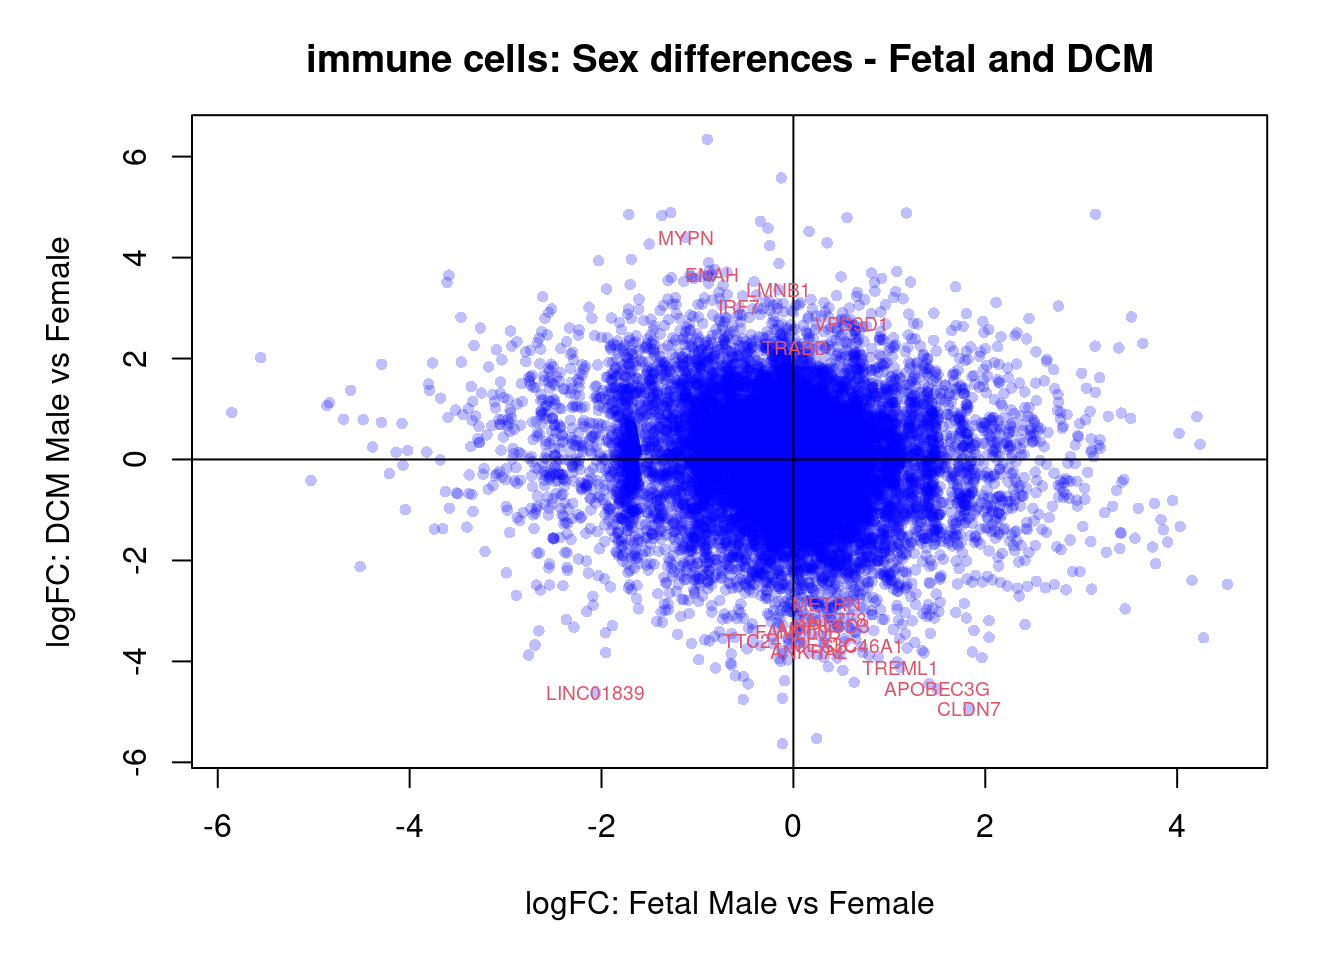
par(mar=c(5,5,3,2))
plot(treat.immune$coefficients[,5],treat.immune$coefficients[,6],xlab="logFC: ND Male vs Female", ylab="logFC: DCM Male vs Female",main="immune cells: Sex differences - ND and DCM",col=rgb(0,0,1,alpha=0.25),pch=16,cex=0.8)
sig.genes <- dt.immune[,5] !=0 | dt.immune[,6] != 0
text(treat.immune$coefficients[sig.genes,5],treat.immune$coefficients[sig.genes,6],labels=rownames(dt.immune)[sig.genes],col=2,cex=0.6)
abline(h=0,v=0)
par(mar=c(5,5,3,2))
plot(treat.immune$coefficients[,4],treat.immune$coefficients[,5],xlab="logFC: Fetal Male vs Female", ylab="logFC: ND Male vs Female",main="immune cells: Interaction term: Fetal vs ND",col=rgb(0,0,1,alpha=0.25),pch=16,cex=0.8)
abline(h=0,v=0)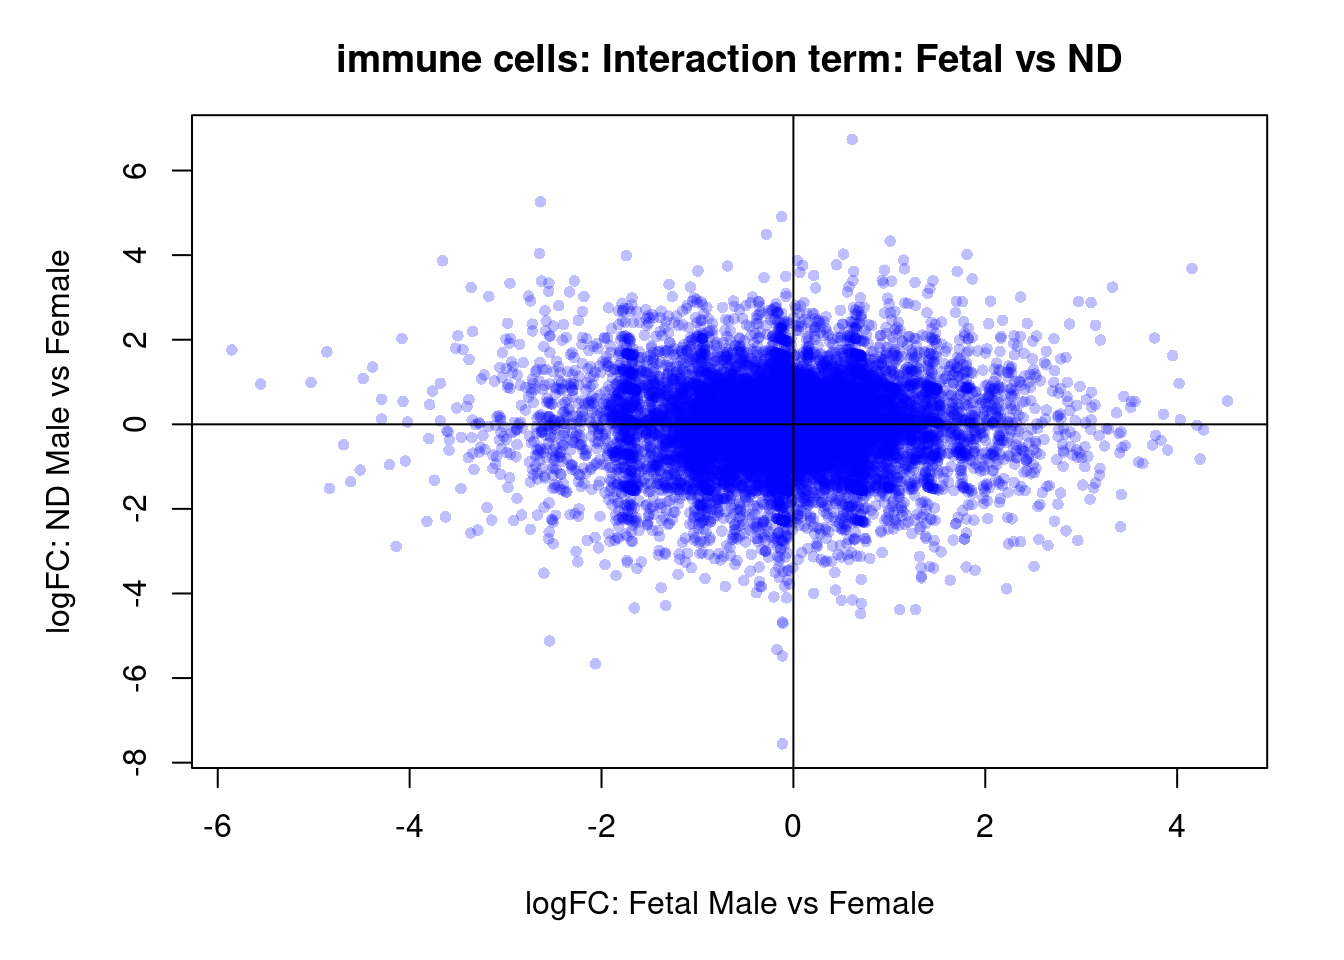
sig.genes <- dt.immune[,8] !=0
if(sum(sig.genes)!=0){
text(treat.immune$coefficients[sig.genes,4],treat.immune$coefficients[sig.genes,5],
labels=rownames(dt.immune)[sig.genes],col=2,cex=0.6)
}par(mar=c(5,5,3,2))
plot(treat.immune$coefficients[,4],treat.immune$coefficients[,6],xlab="logFC: Fetal Male vs Female", ylab="logFC: DCM Male vs Female",main="immune cells: Interaction term: Fetal and DCM",col=rgb(0,0,1,alpha=0.25),pch=16,cex=0.8)
abline(h=0,v=0)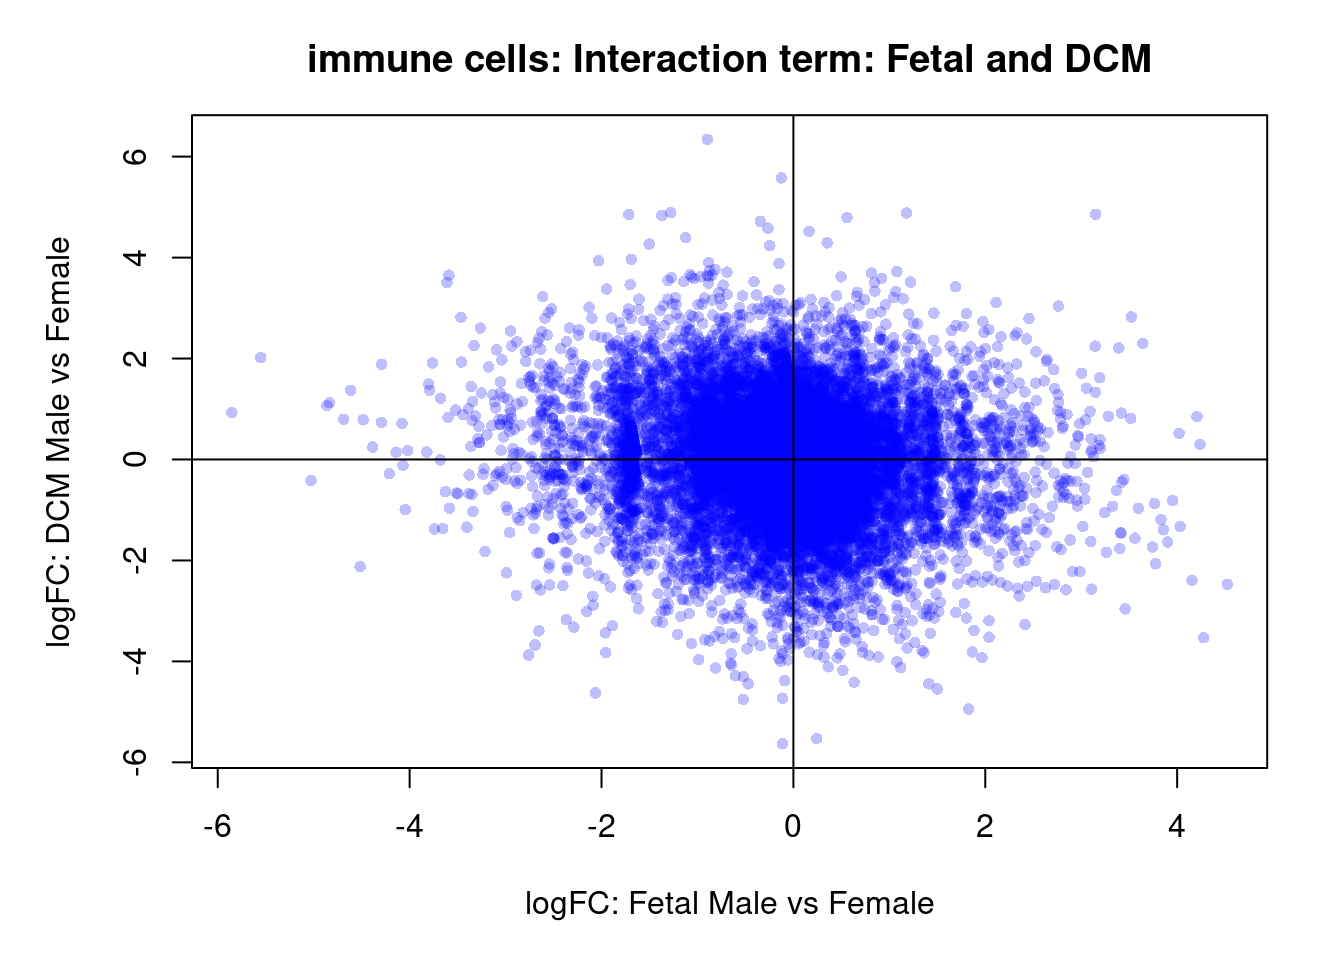
sig.genes <- dt.immune[,7] !=0
if(length(rownames(dt.immune)[sig.genes]) !=0)
text(treat.immune$coefficients[sig.genes,4],treat.immune$coefficients[sig.genes,6],labels=rownames(dt.immune)[sig.genes],col=2,cex=0.6)par(mar=c(5,5,3,2))
plot(treat.immune$coefficients[,5],treat.immune$coefficients[,6],xlab="logFC: ND Male vs Female", ylab="logFC: DCM Male vs Female",main="immune cells: Interaction term: ND and DCM",col=rgb(0,0,1,alpha=0.25),pch=16,cex=0.8)
abline(h=0,v=0)
sig.genes <- dt.immune[,9] !=0
text(treat.immune$coefficients[sig.genes,5],treat.immune$coefficients[sig.genes,6],labels=rownames(dt.immune)[sig.genes],col=2,cex=0.6)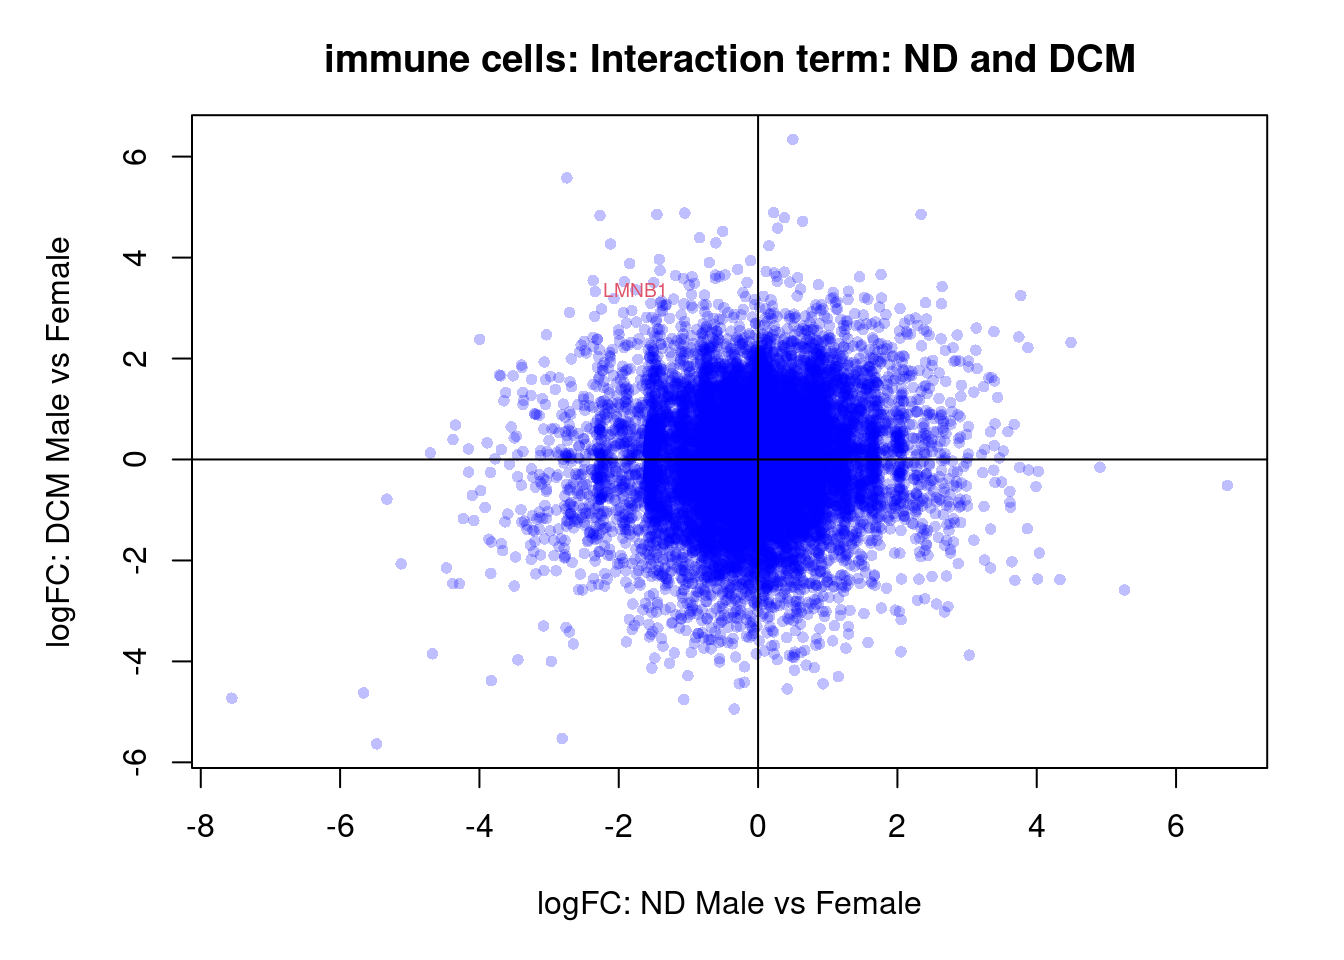
Neurons
cont.neurons <- makeContrasts(NvF = 0.5*(neurons.ND.Male + neurons.ND.Female) - 0.5*(neurons.Fetal.Male + neurons.Fetal.Female),
DvF = 0.5*(neurons.DCM.Male + neurons.DCM.Female) - 0.5*(neurons.Fetal.Male + neurons.Fetal.Female),
DvN = 0.5*(neurons.DCM.Male + neurons.DCM.Female) - 0.5*(neurons.ND.Male + neurons.ND.Female),
SexFetal = neurons.Fetal.Male - neurons.Fetal.Female,
SexND = neurons.ND.Male - neurons.ND.Female,
SexDCM = neurons.DCM.Male - neurons.DCM.Female,
InteractionDF = (neurons.DCM.Male - neurons.Fetal.Male) - (neurons.DCM.Female - neurons.Fetal.Female),
InteractionNF = (neurons.ND.Male - neurons.Fetal.Male) - (neurons.ND.Female - neurons.Fetal.Female),
InteractionDN = (neurons.DCM.Male - neurons.ND.Male) - (neurons.DCM.Female - neurons.ND.Female),
levels=design)
fit.neurons <- contrasts.fit(fit,contrasts = cont.neurons)
fit.neurons <- eBayes(fit.neurons,robust=TRUE)
summary(decideTests(fit.neurons)) NvF DvF DvN SexFetal SexND SexDCM InteractionDF InteractionNF
Down 430 274 15 0 2 15 0 0
NotSig 17379 17703 18107 18140 18129 18123 18141 18141
Up 332 164 19 1 10 3 0 0
InteractionDN
Down 2
NotSig 18139
Up 0treat.neurons <- treat(fit.neurons,lfc=0.5)
dt.neurons<-decideTests(treat.neurons)
summary(dt.neurons) NvF DvF DvN SexFetal SexND SexDCM InteractionDF InteractionNF
Down 214 99 0 0 0 2 0 0
NotSig 17780 17997 18139 18141 18139 18139 18141 18141
Up 147 45 2 0 2 0 0 0
InteractionDN
Down 0
NotSig 18141
Up 0par(mfrow=c(3,3))
for(i in 1:9){
plotMD(treat.neurons,coef=i,status=dt.neurons[,i],hl.col=c("blue","red"))
abline(h=0,col="grey")
}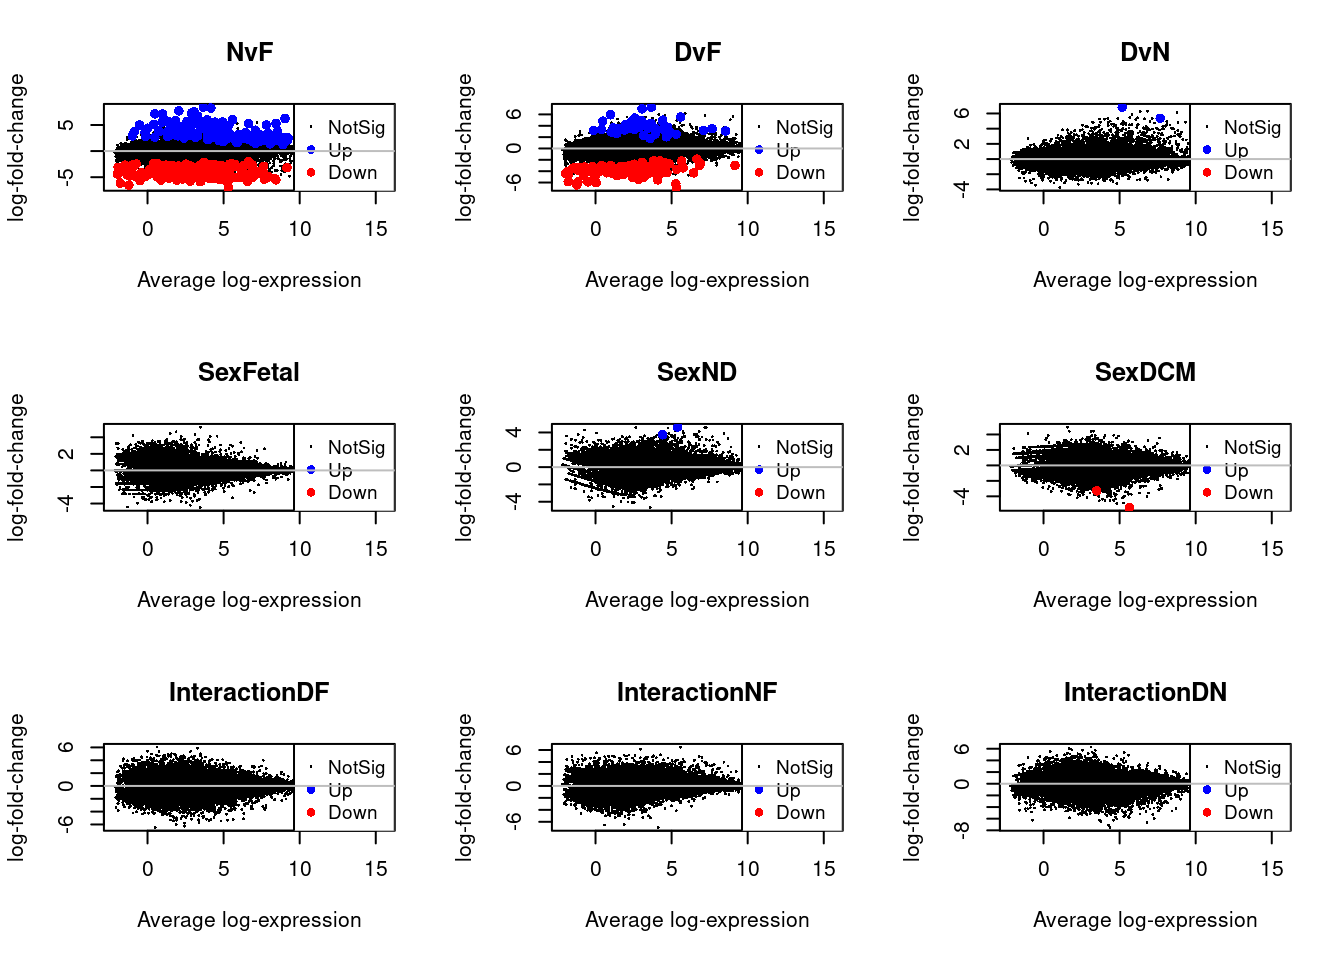
par(mfrow=c(1,1))
par(mar=c(7,4,2,2))
barplot(summary(dt.neurons)[-2,],beside=TRUE,legend=TRUE,col=c("blue","red"),ylab="Number of significant genes",las=2)
title("Neurons")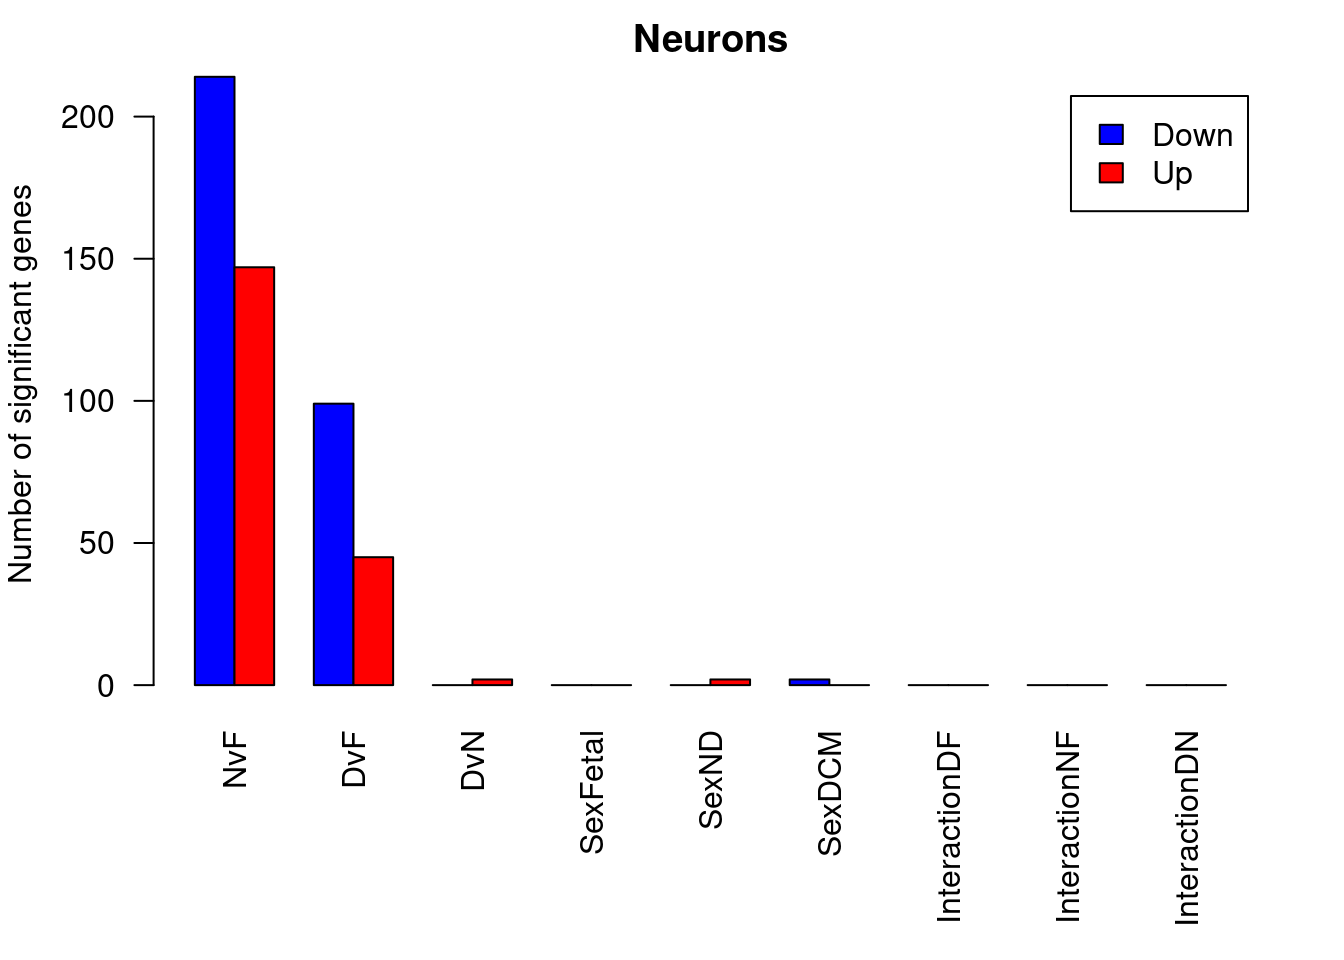
ND vs Fetal
options(digits=3)
topTreat(treat.neurons,coef=1,n=20,p.value=0.05)[,-c(1:3)] GENENAME CHR logFC
LINC00598 long intergenic non-protein coding RNA 598 13 4.10
PHOX2B paired like homeobox 2B 4 -6.13
SLC5A8 solute carrier family 5 member 8 12 -5.67
RANBP17 RAN binding protein 17 5 -4.37
UBA7 ubiquitin like modifier activating enzyme 7 3 5.20
GBP2 guanylate binding protein 2 1 8.43
NRN1 neuritin 1 6 7.13
IGF2BP1 insulin like growth factor 2 mRNA binding protein 1 17 -5.20
COL20A1 collagen type XX alpha 1 chain 20 -4.74
COL2A1 collagen type II alpha 1 chain 12 -6.53
OGFRL1 opioid growth factor receptor like 1 6 5.59
ADRA1B adrenoceptor alpha 1B 5 7.28
SHISA9 shisa family member 9 16 3.02
KCNH5 potassium voltage-gated channel subfamily H member 5 14 -5.08
GLDN gliomedin 15 7.54
NPTX2 neuronal pentraxin 2 7 7.14
NAV3 neuron navigator 3 12 -5.36
DHH desert hedgehog signaling molecule 12 -4.93
MMD2 monocyte to macrophage differentiation associated 2 7 -5.55
FAM135B family with sequence similarity 135 member B 8 4.59
AveExpr t P.Value adj.P.Val
LINC00598 4.661 10.28 4.80e-12 8.71e-08
PHOX2B -1.793 -9.45 3.88e-11 3.52e-07
SLC5A8 -0.497 -9.04 1.11e-10 6.74e-07
RANBP17 7.180 -7.83 2.79e-09 1.27e-05
UBA7 2.838 7.71 4.00e-09 1.43e-05
GBP2 3.672 7.64 5.03e-09 1.43e-05
NRN1 0.985 7.60 5.52e-09 1.43e-05
IGF2BP1 1.430 -7.24 1.46e-08 2.94e-05
COL20A1 -1.162 -7.18 1.76e-08 2.94e-05
COL2A1 -1.223 -7.16 1.87e-08 2.94e-05
OGFRL1 4.930 7.15 1.92e-08 2.94e-05
ADRA1B 2.893 7.16 1.95e-08 2.94e-05
SHISA9 2.741 7.03 2.65e-08 3.70e-05
KCNH5 1.426 -6.97 3.18e-08 4.12e-05
GLDN 3.057 6.95 3.47e-08 4.19e-05
NPTX2 0.472 6.92 3.80e-08 4.31e-05
NAV3 7.670 -6.78 5.41e-08 5.66e-05
DHH -0.187 -6.77 5.62e-08 5.66e-05
MMD2 0.880 -6.72 6.59e-08 6.29e-05
FAM135B 2.467 6.66 7.62e-08 6.92e-05DCM vs Fetal
topTreat(treat.neurons,coef=2,n=20,p.value=0.05)[,-c(1:3)] GENENAME CHR
SLC5A8 solute carrier family 5 member 8 12
COL20A1 collagen type XX alpha 1 chain 20
PHOX2B paired like homeobox 2B 4
ALK ALK receptor tyrosine kinase 2
UBA7 ubiquitin like modifier activating enzyme 7 3
COL2A1 collagen type II alpha 1 chain 12
DLX1 distal-less homeobox 1 2
IGF2BP1 insulin like growth factor 2 mRNA binding protein 1 17
LINC00682 long intergenic non-protein coding RNA 682 4
ITGB4 integrin subunit beta 4 17
IGF2BP3 insulin like growth factor 2 mRNA binding protein 3 7
CNTN6 contactin 6 3
CNTNAP2 contactin associated protein 2 7
FAM135B family with sequence similarity 135 member B 8
GLDN gliomedin 15
GBP2 guanylate binding protein 2 1
NRN1 neuritin 1 6
TRPM3 transient receptor potential cation channel subfamily M member 3 9
MDGA2 MAM domain containing glycosylphosphatidylinositol anchor 2 14
STAC SH3 and cysteine rich domain 3
logFC AveExpr t P.Value adj.P.Val
SLC5A8 -5.87 -0.497 -9.76 1.77e-11 2.58e-07
COL20A1 -5.91 -1.162 -9.57 2.84e-11 2.58e-07
PHOX2B -5.84 -1.793 -9.26 6.28e-11 3.80e-07
ALK 3.72 3.464 8.19 1.06e-09 4.80e-06
UBA7 4.90 2.838 7.38 9.79e-09 3.55e-05
COL2A1 -6.44 -1.223 -7.31 1.24e-08 3.76e-05
DLX1 -4.72 -1.803 -7.18 1.75e-08 4.53e-05
IGF2BP1 -4.80 1.430 -6.88 4.09e-08 9.27e-05
LINC00682 -4.40 -1.969 -6.72 6.51e-08 1.31e-04
ITGB4 4.78 2.385 6.64 8.07e-08 1.46e-04
IGF2BP3 -4.41 4.262 -6.44 1.43e-07 2.36e-04
CNTN6 -5.07 3.181 -6.39 1.67e-07 2.53e-04
CNTNAP2 -4.30 6.449 -6.30 2.17e-07 3.03e-04
FAM135B 4.41 2.467 6.14 3.40e-07 4.33e-04
GLDN 6.98 3.057 6.15 3.58e-07 4.33e-04
GBP2 7.28 3.672 6.06 4.59e-07 5.20e-04
NRN1 5.94 0.985 6.02 4.99e-07 5.32e-04
TRPM3 -3.41 5.761 -5.90 6.94e-07 6.70e-04
MDGA2 -4.33 3.270 -5.90 7.02e-07 6.70e-04
STAC -4.57 2.990 -5.84 8.24e-07 7.48e-04DCM vs ND
topTreat(treat.neurons,coef=3)[,-c(1:3)] GENENAME CHR logFC AveExpr t
NAV3 neuron navigator 3 12 5.37 7.67 6.60
MYPN myopalladin 10 6.84 5.17 5.55
MET MET proto-oncogene, receptor tyrosine kinase 7 4.25 2.88 4.85
GPAT3 glycerol-3-phosphate acyltransferase 3 4 5.45 5.67 4.61
DPF3 double PHD fingers 3 14 5.42 6.16 4.55
LINC00598 long intergenic non-protein coding RNA 598 13 -2.05 4.66 -4.52
JPH1 junctophilin 1 8 5.25 4.01 4.51
MYO18B myosin XVIIIB 22 6.28 6.83 4.48
PPARGC1A PPARG coactivator 1 alpha 4 5.22 6.05 4.44
ALK ALK receptor tyrosine kinase 2 2.38 3.46 4.22
P.Value adj.P.Val
NAV3 9.21e-08 0.00167
MYPN 2.08e-06 0.01883
MET 1.53e-05 0.09262
GPAT3 3.14e-05 0.10505
DPF3 3.82e-05 0.10505
LINC00598 3.82e-05 0.10505
JPH1 4.19e-05 0.10505
MYO18B 4.79e-05 0.10505
PPARGC1A 5.21e-05 0.10505
ALK 9.10e-05 0.15040Male vs Female in Fetal samples
topTreat(treat.neurons,coef=4)[,-c(1:3)] GENENAME
SLC48A1 solute carrier family 48 member 1
FRS3 fibroblast growth factor receptor substrate 3
STAC3 SH3 and cysteine rich domain 3
CAMSAP3 calmodulin regulated spectrin associated protein family member 3
WDR5B WD repeat domain 5B
LINC02347 long intergenic non-protein coding RNA 2347
FA2H fatty acid 2-hydroxylase
MAMSTR MEF2 activating motif and SAP domain containing transcriptional regulator
SNRNP25 small nuclear ribonucleoprotein U11/U12 subunit 25
BAALC BAALC binder of MAP3K1 and KLF4
CHR logFC AveExpr t P.Value adj.P.Val
SLC48A1 12 3.66 3.2627 4.96 1.09e-05 0.198
FRS3 6 3.65 2.3486 4.24 8.96e-05 0.813
STAC3 12 4.11 2.2117 4.04 1.58e-04 0.953
CAMSAP3 19 3.30 -0.0384 3.60 5.39e-04 1.000
WDR5B 3 -2.99 1.1511 -3.56 5.92e-04 1.000
LINC02347 12 -4.42 -1.3321 -3.43 9.05e-04 1.000
FA2H 16 -3.26 0.6095 -3.38 9.71e-04 1.000
MAMSTR 19 3.63 2.3998 3.38 1.00e-03 1.000
SNRNP25 16 3.51 1.7396 3.27 1.35e-03 1.000
BAALC 8 4.48 1.4908 3.26 1.44e-03 1.000Male vs Female in ND samples
topTreat(treat.neurons,coef=5)[,-c(1:3)] GENENAME CHR logFC
DEDD death effector domain containing 1 3.74
CCDC18 coiled-coil domain containing 18 1 4.62
MITD1 microtubule interacting and trafficking domain containing 1 2 3.90
ZRANB3 zinc finger RANBP2-type containing 3 2 3.47
RANBP17 RAN binding protein 17 5 4.61
DNTTIP1 deoxynucleotidyltransferase terminal interacting protein 1 20 3.72
CREBL2 cAMP responsive element binding protein like 2 12 4.50
FTSJ3 FtsJ RNA 2'-O-methyltransferase 3 17 -3.61
COG1 component of oligomeric golgi complex 1 17 2.97
MSI1 musashi RNA binding protein 1 12 -4.10
AveExpr t P.Value adj.P.Val
DEDD 4.41 5.62 1.59e-06 0.0274
CCDC18 5.39 5.40 3.02e-06 0.0274
MITD1 4.57 5.02 9.05e-06 0.0547
ZRANB3 6.65 4.88 1.39e-05 0.0630
RANBP17 7.18 4.68 2.54e-05 0.0757
DNTTIP1 4.10 4.64 2.82e-05 0.0757
CREBL2 4.77 4.63 2.92e-05 0.0757
FTSJ3 3.18 -4.41 5.49e-05 0.1150
COG1 4.19 4.36 6.11e-05 0.1150
MSI1 2.54 -4.36 6.34e-05 0.1150Male vs Female in DCM samples
topTreat(treat.neurons,coef=6)[,-c(1:3)] GENENAME CHR logFC AveExpr
RPUSD3 RNA pseudouridine synthase D3 3 -3.29 3.49
CEP162 centrosomal protein 162 6 -5.45 5.64
C10orf88 chromosome 10 open reading frame 88 10 -3.57 4.22
TSEN15 tRNA splicing endonuclease subunit 15 1 -4.21 5.18
POLDIP2 DNA polymerase delta interacting protein 2 17 -2.85 3.79
AKIP1 A-kinase interacting protein 1 11 -3.27 3.27
ELAC2 elaC ribonuclease Z 2 17 -3.37 3.94
STK11IP serine/threonine kinase 11 interacting protein 2 3.66 2.90
ATPSCKMT ATP synthase c subunit lysine N-methyltransferase 5 -3.41 4.24
BIN3 bridging integrator 3 8 2.73 5.42
t P.Value adj.P.Val
RPUSD3 -5.54 1.95e-06 0.0354
CEP162 -5.29 4.28e-06 0.0388
C10orf88 -4.72 2.19e-05 0.1010
TSEN15 -4.71 2.31e-05 0.1010
POLDIP2 -4.54 3.70e-05 0.1010
AKIP1 -4.48 4.43e-05 0.1010
ELAC2 -4.48 4.46e-05 0.1010
STK11IP 4.44 4.90e-05 0.1010
ATPSCKMT -4.39 5.75e-05 0.1010
BIN3 4.37 6.06e-05 0.1010Interaction of sex differences between DCM and Fetal
topTreat(treat.neurons,coef=7)[,-c(1:3)] GENENAME CHR logFC AveExpr t
WDR5B WD repeat domain 5B 3 4.83 1.151 4.58
CEP162 centrosomal protein 162 6 -5.25 5.635 -3.99
PRR22 proline rich 22 19 6.05 0.631 3.94
SLC48A1 solute carrier family 48 member 1 12 -3.96 3.263 -3.89
TSEN15 tRNA splicing endonuclease subunit 15 1 -4.42 5.185 -3.86
RPUSD3 RNA pseudouridine synthase D3 3 -3.09 3.493 -3.73
C1orf131 chromosome 1 open reading frame 131 1 -3.97 4.040 -3.57
PCBD1 pterin-4 alpha-carbinolamine dehydratase 1 10 -5.07 2.204 -3.55
FRS3 fibroblast growth factor receptor substrate 3 6 -4.16 2.349 -3.53
RFC2 replication factor C subunit 2 7 3.20 4.082 3.49
P.Value adj.P.Val
WDR5B 3.36e-05 0.61
CEP162 1.91e-04 0.93
PRR22 2.29e-04 0.93
SLC48A1 2.45e-04 0.93
TSEN15 2.66e-04 0.93
RPUSD3 3.76e-04 0.93
C1orf131 6.06e-04 0.93
PCBD1 6.64e-04 0.93
FRS3 6.75e-04 0.93
RFC2 7.26e-04 0.93Interaction of sex differences between ND and Fetal
topTreat(treat.neurons,coef=8)[,-c(1:3)] GENENAME CHR logFC
DEDD death effector domain containing 1 3.76
ZRANB3 zinc finger RANBP2-type containing 3 2 3.36
CCDC18 coiled-coil domain containing 18 1 4.32
CORO7 coronin 7 16 -5.01
PMEL premelanosome protein 12 -5.29
MITD1 microtubule interacting and trafficking domain containing 1 2 3.83
CREBL2 cAMP responsive element binding protein like 2 12 4.65
PNPO pyridoxamine 5'-phosphate oxidase 17 -5.01
TADA1 transcriptional adaptor 1 1 3.60
WDR5B WD repeat domain 5B 3 3.94
AveExpr t P.Value adj.P.Val
DEDD 4.413 4.24 8.89e-05 0.881
ZRANB3 6.646 4.13 1.21e-04 0.881
CCDC18 5.392 4.04 1.59e-04 0.881
CORO7 0.663 -3.80 3.24e-04 0.881
PMEL 1.302 -3.73 4.06e-04 0.881
MITD1 4.569 3.64 4.84e-04 0.881
CREBL2 4.767 3.63 5.26e-04 0.881
PNPO 1.526 -3.62 5.42e-04 0.881
TADA1 3.728 3.60 5.42e-04 0.881
WDR5B 1.151 3.56 6.20e-04 0.881Interaction of sex differences between DCM and ND
topTreat(treat.neurons,coef=9)[,-c(1:3)] GENENAME CHR logFC
ALKBH7 alkB homolog 7 19 -5.08
COG1 component of oligomeric golgi complex 1 17 -4.57
SCOC-AS1 SCOC antisense RNA 1 4 -5.02
ZNF85 zinc finger protein 85 19 -6.52
MITD1 microtubule interacting and trafficking domain containing 1 2 -4.97
ANP32E acidic nuclear phosphoprotein 32 family member E 1 -4.75
NMNAT1 nicotinamide nucleotide adenylyltransferase 1 1 -4.57
IMP4 IMP U3 small nucleolar ribonucleoprotein 4 2 -4.59
SVBP small vasohibin binding protein 1 -5.24
PRADC1 protease associated domain containing 1 2 -3.77
AveExpr t P.Value adj.P.Val
ALKBH7 3.08 -5.21 5.40e-06 0.0722
COG1 4.19 -5.07 7.96e-06 0.0722
SCOC-AS1 2.52 -4.64 2.87e-05 0.1396
ZNF85 3.76 -4.62 3.20e-05 0.1396
MITD1 4.57 -4.54 3.85e-05 0.1396
ANP32E 4.26 -4.39 5.89e-05 0.1781
NMNAT1 5.16 -4.14 1.23e-04 0.2093
IMP4 3.01 -4.13 1.26e-04 0.2093
SVBP 2.86 -4.13 1.29e-04 0.2093
PRADC1 2.64 -4.10 1.34e-04 0.2093par(mar=c(5,5,3,2))
plot(treat.neurons$coefficients[,1],treat.neurons$coefficients[,2],xlab="logFC: ND vs Fetal", ylab="logFC: DCM vs Fetal",main="neurons",col=rgb(0,0,1,alpha=0.25),pch=16,cex=0.8)
abline(h=0,v=0,col=colours()[c(175)])
sig.genes <- dt.neurons[,1] !=0 | dt.neurons[,2] != 0
text(treat.neurons$coefficients[sig.genes,1],treat.neurons$coefficients[sig.genes,2],labels=rownames(dt.neurons)[sig.genes],col=2,cex=0.6)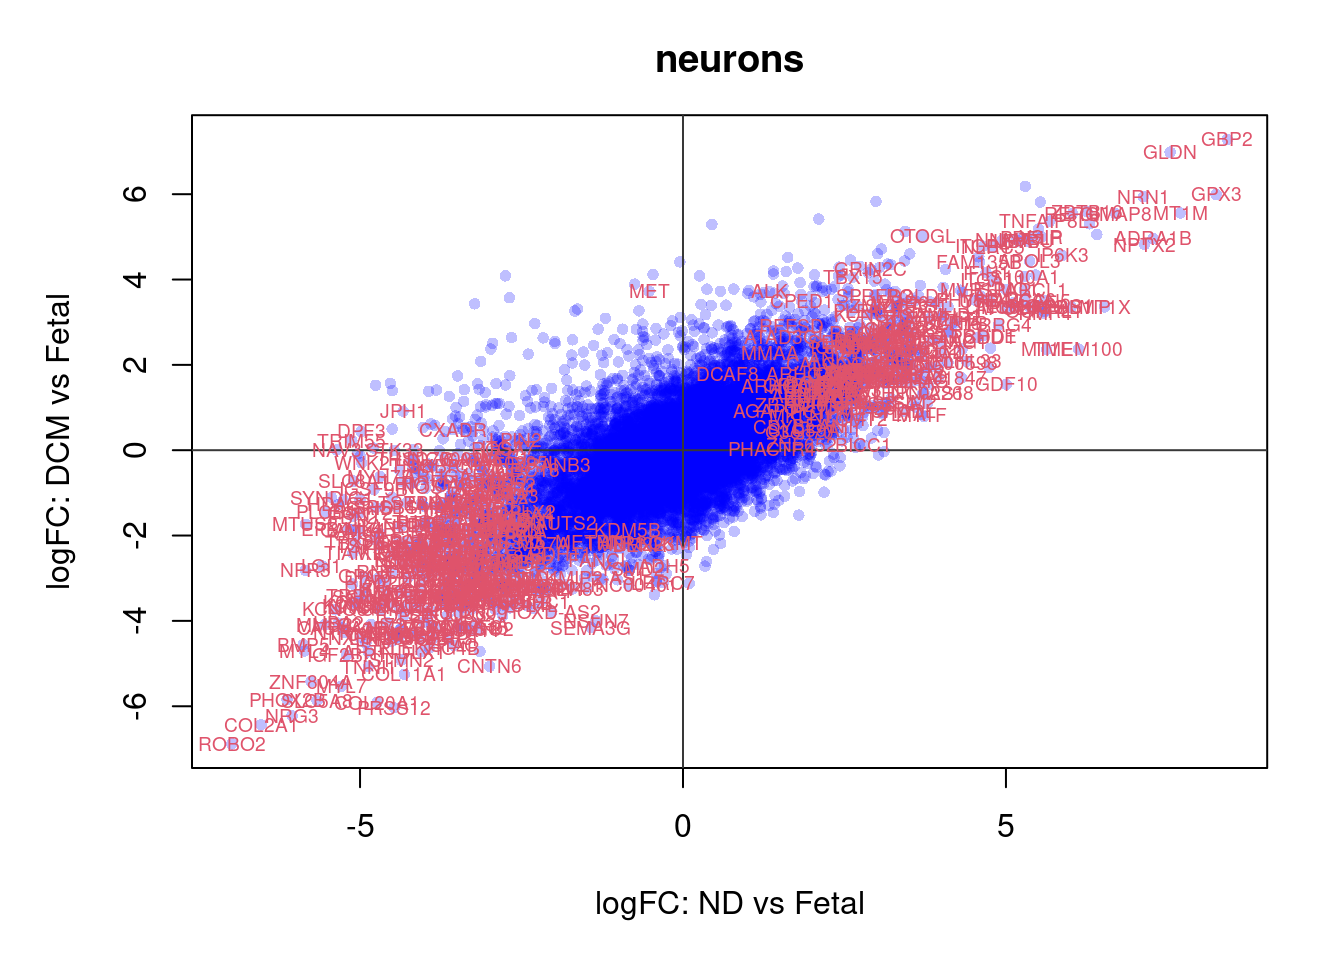
par(mar=c(5,5,3,2))
plot(treat.neurons$coefficients[,4],treat.neurons$coefficients[,5],xlab="logFC: Fetal Male vs Female", ylab="logFC: ND Male vs Female",main="neurons: Sex differences - Fetal and ND",col=rgb(0,0,1,alpha=0.25),pch=16,cex=0.8)
abline(h=0,v=0)
sig.genes <- dt.neurons[,4] !=0 | dt.neurons[,5] != 0
text(treat.neurons$coefficients[sig.genes,4],treat.neurons$coefficients[sig.genes,5],labels=rownames(dt.neurons)[sig.genes],col=2,cex=0.6)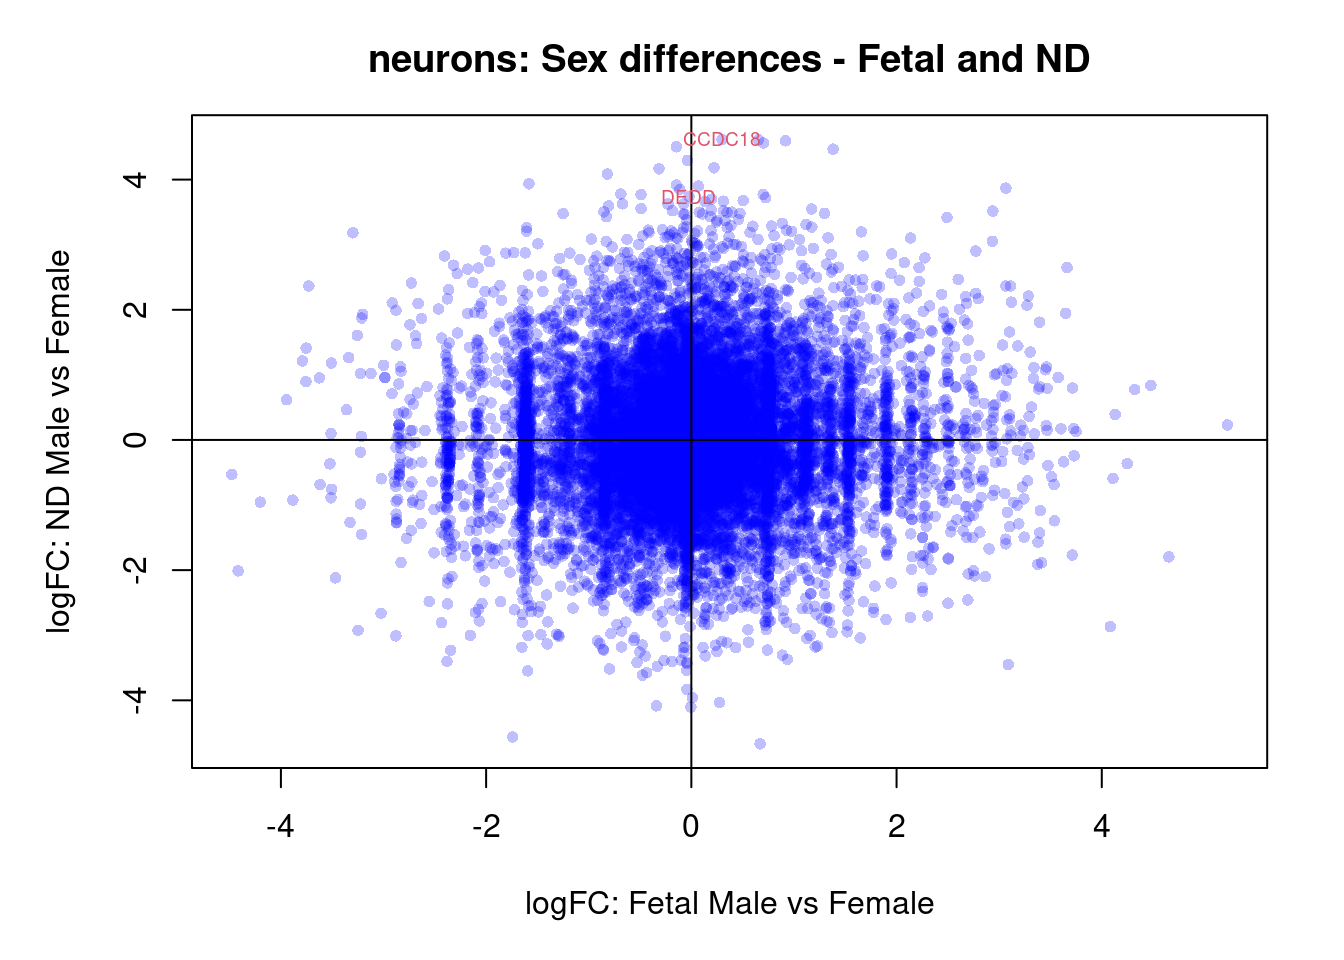
par(mar=c(5,5,3,2))
plot(treat.neurons$coefficients[,4],treat.neurons$coefficients[,6],xlab="logFC: Fetal Male vs Female", ylab="logFC: DCM Male vs Female",main="neurons: Sex differences - Fetal and DCM",col=rgb(0,0,1,alpha=0.25),pch=16,cex=0.8)
abline(h=0,v=0)
sig.genes <- dt.neurons[,4] !=0 | dt.neurons[,6] != 0
if(sum(sig.genes)!=0){
text(treat.neurons$coefficients[sig.genes,4],treat.neurons$coefficients[sig.genes,6],
labels=rownames(dt.neurons)[sig.genes],col=2,cex=0.6)
}
par(mar=c(5,5,3,2))
plot(treat.neurons$coefficients[,5],treat.neurons$coefficients[,6],xlab="logFC: ND Male vs Female", ylab="logFC: DCM Male vs Female",main="neurons: Sex differences - ND and DCM",col=rgb(0,0,1,alpha=0.25),pch=16,cex=0.8)
sig.genes <- dt.neurons[,5] !=0 | dt.neurons[,6] != 0
text(treat.neurons$coefficients[sig.genes,5],treat.neurons$coefficients[sig.genes,6],labels=rownames(dt.neurons)[sig.genes],col=2,cex=0.6)
abline(h=0,v=0)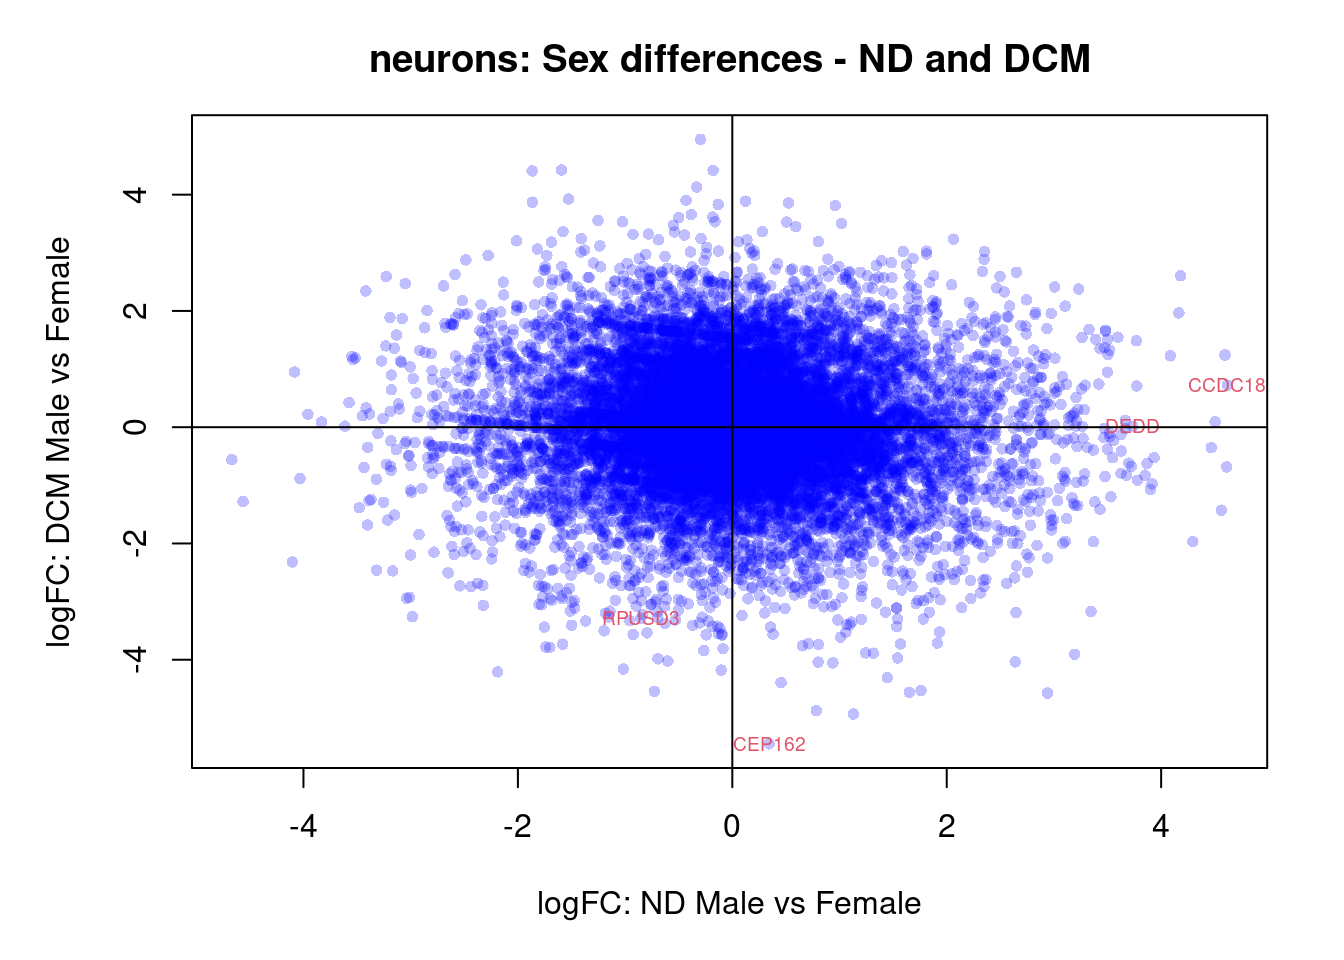
par(mar=c(5,5,3,2))
plot(treat.neurons$coefficients[,4],treat.neurons$coefficients[,5],xlab="logFC: Fetal Male vs Female", ylab="logFC: ND Male vs Female",main="neurons: Interaction term: Fetal vs ND",col=rgb(0,0,1,alpha=0.25),pch=16,cex=0.8)
abline(h=0,v=0)
sig.genes <- dt.neurons[,8] !=0
if(sum(sig.genes)!=0){
text(treat.neurons$coefficients[sig.genes,4],treat.neurons$coefficients[sig.genes,5],
labels=rownames(dt.neurons)[sig.genes],col=2,cex=0.6)
}par(mar=c(5,5,3,2))
plot(treat.neurons$coefficients[,4],treat.neurons$coefficients[,6],xlab="logFC: Fetal Male vs Female", ylab="logFC: DCM Male vs Female",main="neurons: Interaction term: Fetal and DCM",col=rgb(0,0,1,alpha=0.25),pch=16,cex=0.8)
abline(h=0,v=0)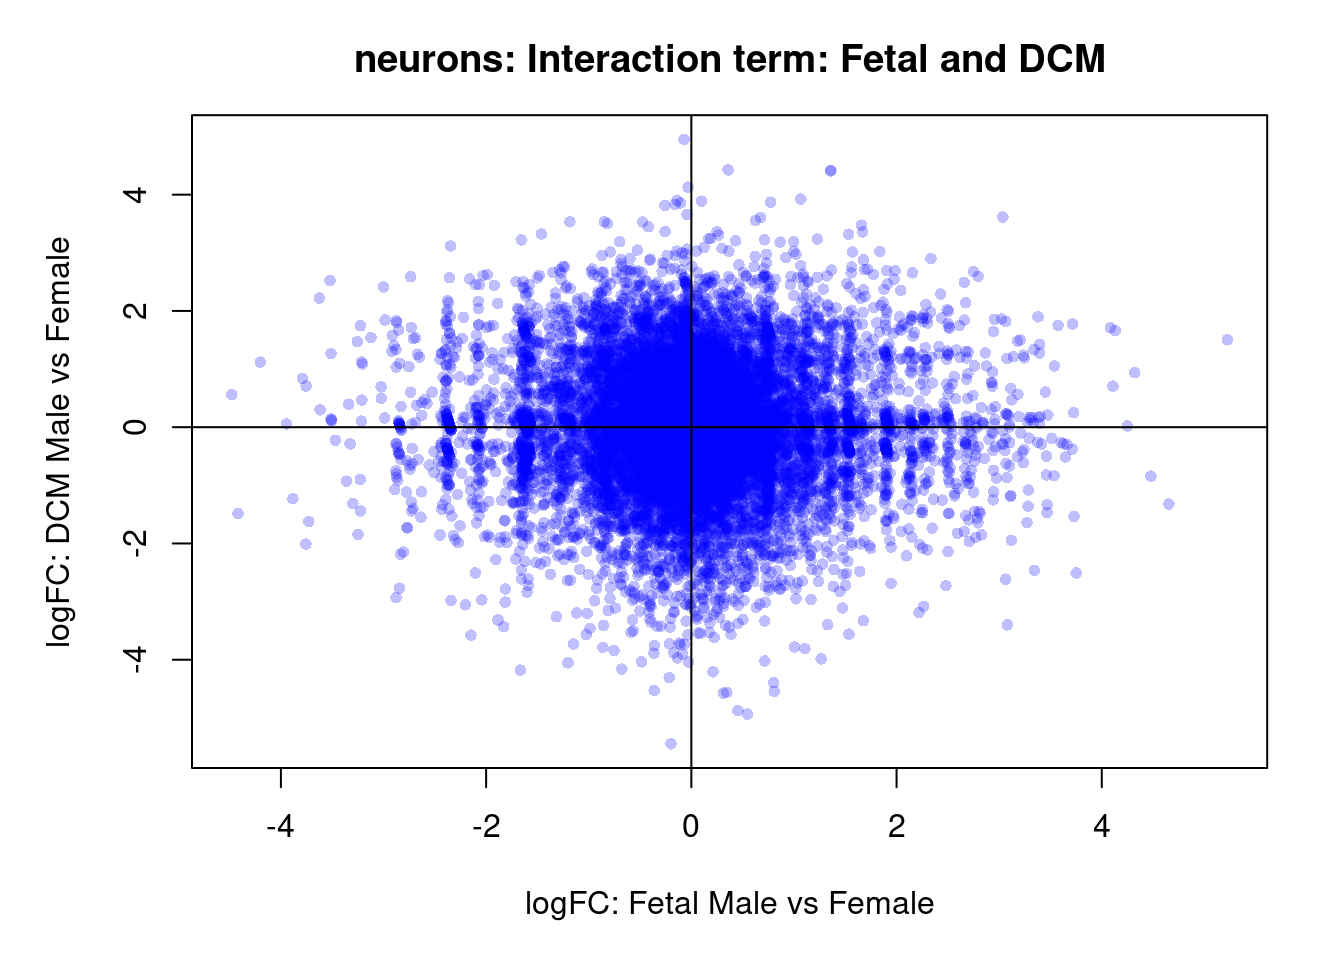
sig.genes <- dt.neurons[,7] !=0
if(sum(sig.genes)!=0){
text(treat.neurons$coefficients[sig.genes,4],treat.neurons$coefficients[sig.genes,6],
labels=rownames(dt.neurons)[sig.genes],col=2,cex=0.6)
}par(mar=c(5,5,3,2))
plot(treat.neurons$coefficients[,5],treat.neurons$coefficients[,6],xlab="logFC: ND Male vs Female", ylab="logFC: DCM Male vs Female",main="neurons: Interaction term: ND and DCM",col=rgb(0,0,1,alpha=0.25),pch=16,cex=0.8)
abline(h=0,v=0)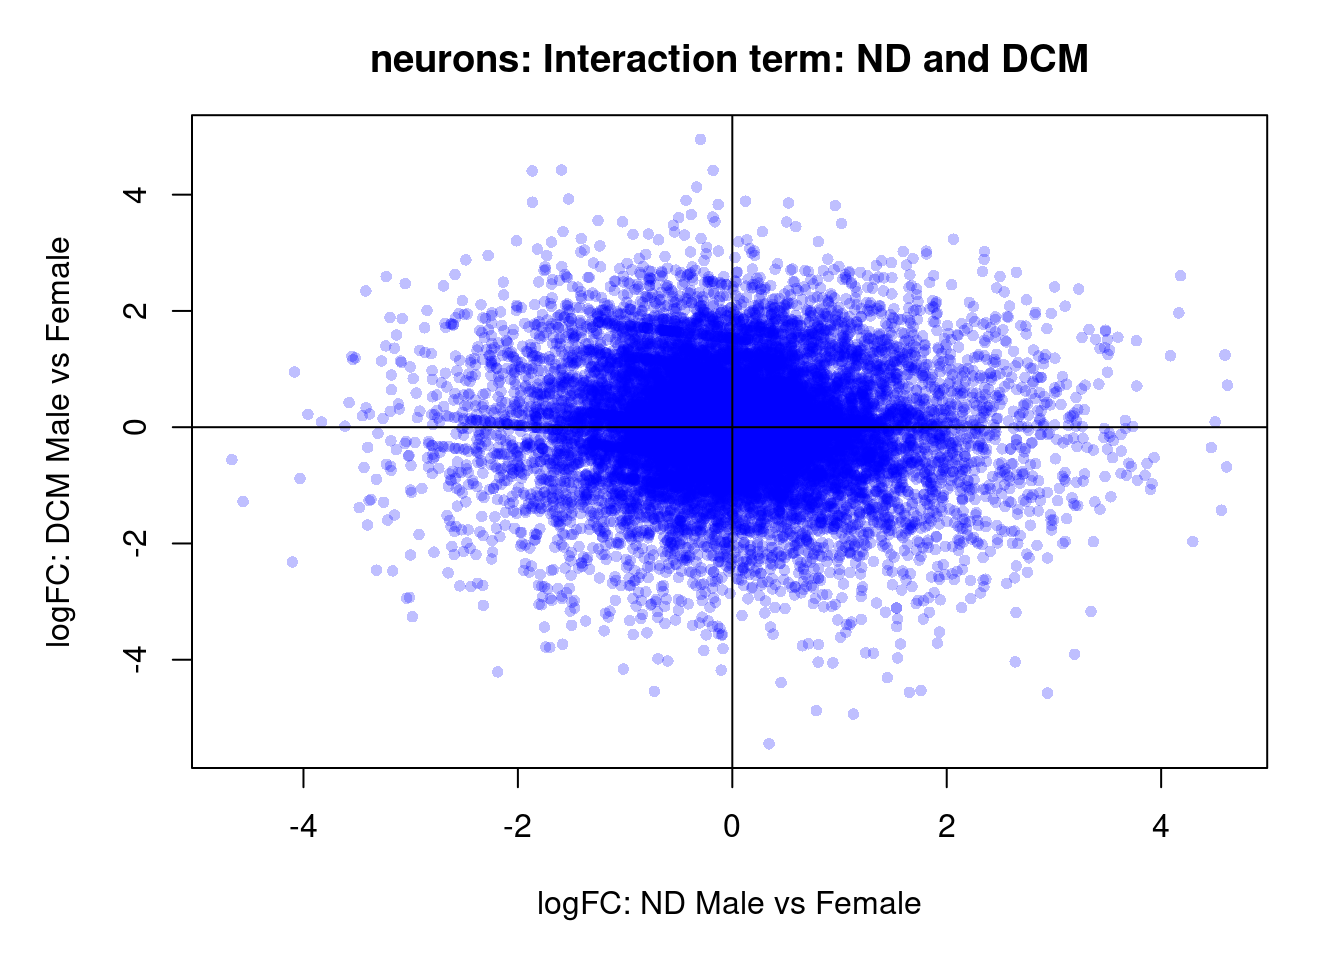
sig.genes <- dt.neurons[,9] !=0
if(length(rownames(dt.neurons)[sig.genes]) !=0)
text(treat.neurons$coefficients[sig.genes,5],treat.neurons$coefficients[sig.genes,6],labels=rownames(dt.neurons)[sig.genes],col=2,cex=0.6)Write out results
fdr.cardio <- apply(treat.cardio$p.value, 2, function(x) p.adjust(x, method="BH"))
output.cardio <- data.frame(treat.cardio$genes,LogFC=treat.cardio$coefficients,AveExp=treat.cardio$Amean,tstat=treat.cardio$t, pvalue=treat.cardio$p.value, fdr=fdr.cardio)
write.csv(output.cardio,file="./output/DEAnalysis/BroadCellTypes/de-cardio-all.csv")
fdr.endo <- apply(treat.endo$p.value, 2, function(x) p.adjust(x, method="BH"))
output.endo <- data.frame(treat.endo$genes,LogFC=treat.endo$coefficients,AveExp=treat.endo$Amean,tstat=treat.endo$t, pvalue=treat.endo$p.value, fdr=fdr.endo)
write.csv(output.endo,file="./output/DEAnalysis/BroadCellTypes/de-endo-all.csv")
fdr.peri <- apply(treat.peri$p.value, 2, function(x) p.adjust(x, method="BH"))
output.peri <- data.frame(treat.peri$genes,LogFC=treat.peri$coefficients,AveExp=treat.peri$Amean,tstat=treat.peri$t, pvalue=treat.peri$p.value, fdr=fdr.peri)
write.csv(output.peri,file="./output/DEAnalysis/BroadCellTypes/de-pericyte-all.csv")
fdr.fibro <- apply(treat.fibro$p.value, 2, function(x) p.adjust(x, method="BH"))
output.fibro <- data.frame(treat.fibro$genes,LogFC=treat.fibro$coefficients,AveExp=treat.fibro$Amean,tstat=treat.fibro$t, pvalue=treat.fibro$p.value, fdr=fdr.fibro)
write.csv(output.fibro,file="./output/DEAnalysis/BroadCellTypes/de-fibro-all.csv")
fdr.immune <- apply(treat.immune$p.value, 2, function(x) p.adjust(x, method="BH"))
output.immune <- data.frame(treat.immune$genes,LogFC=treat.immune$coefficients,AveExp=treat.immune$Amean,tstat=treat.immune$t, pvalue=treat.immune$p.value, fdr=fdr.immune)
write.csv(output.immune,file="./output/DEAnalysis/BroadCellTypes/de-immune-all.csv")
fdr.neurons <- apply(treat.neurons$p.value, 2, function(x) p.adjust(x, method="BH"))
output.neurons <- data.frame(treat.neurons$genes,LogFC=treat.neurons$coefficients,AveExp=treat.neurons$Amean,tstat=treat.neurons$t, pvalue=treat.neurons$p.value, fdr=fdr.neurons)
write.csv(output.neurons,file="./output/DEAnalysis/BroadCellTypes/de-neurons-all.csv")
fdr.smc <- apply(treat.smc$p.value, 2, function(x) p.adjust(x, method="BH"))
output.smc <- data.frame(treat.smc$genes,LogFC=treat.smc$coefficients,AveExp=treat.smc$Amean,tstat=treat.smc$t, pvalue=treat.smc$p.value, fdr=fdr.smc)
write.csv(output.smc,file="./output/DEAnalysis/BroadCellTypes/de-smc-all.csv")# Standard limma analysis with no fold change cut-off
# Cardiomyocytes
for(i in 1:ncol(fit.cardio)){
write.csv(topTable(fit.cardio,coef=i,n="Inf"),
file=paste("./output/DEAnalysis/BroadCellTypes/STD-ind/de-cardio-",colnames(fit.cardio)[i],".csv",sep=""),
row.names = FALSE)
}
# Endothelium
for(i in 1:ncol(fit.endo)){
write.csv(topTable(fit.endo,coef=i,n="Inf"),
file=paste("./output/DEAnalysis/BroadCellTypes/STD-ind/de-endo-",colnames(fit.endo)[i],".csv",sep=""),
row.names = FALSE)
}
# Pericyte
for(i in 1:ncol(fit.peri)){
write.csv(topTable(fit.peri,coef=i,n="Inf"),
file=paste("./output/DEAnalysis/BroadCellTypes/STD-ind/de-pericyte-",colnames(fit.peri)[i],".csv",sep=""),
row.names = FALSE)
}
# Fibroblasts
for(i in 1:ncol(fit.fibro)){
write.csv(topTable(fit.fibro,coef=i,n="Inf"),
file=paste("./output/DEAnalysis/BroadCellTypes/STD-ind/de-fibro-",colnames(fit.fibro)[i],".csv",sep=""),
row.names = FALSE)
}
# Immune
for(i in 1:ncol(fit.immune)){
write.csv(topTable(fit.immune,coef=i,n="Inf"),
file=paste("./output/DEAnalysis/BroadCellTypes/STD-ind/de-immune-",colnames(fit.immune)[i],".csv",sep=""),
row.names = FALSE)
}
# Neurons
for(i in 1:ncol(fit.neurons)){
write.csv(topTable(fit.neurons,coef=i,n="Inf"),
file=paste("./output/DEAnalysis/BroadCellTypes/STD-ind/de-neurons-",colnames(fit.neurons)[i],".csv",sep=""),
row.names = FALSE)
}
# smooth muscle cells
for(i in 1:ncol(fit.smc)){
write.csv(topTable(fit.smc,coef=i,n="Inf"),
file=paste("./output/DEAnalysis/BroadCellTypes/STD-ind/de-smc-",colnames(fit.smc)[i],".csv",sep=""),
row.names = FALSE)
}
# TREAT analysis with log-fold change cut-off of 0.5
# Cardiomyocytes
for(i in 1:ncol(treat.cardio)){
write.csv(topTreat(treat.cardio,coef=i,n="Inf"),
file=paste("./output/DEAnalysis/BroadCellTypes/TREAT-indiv/de-cardio-",colnames(treat.cardio)[i],".csv",sep=""),
row.names = FALSE)
}
# Endothelium
for(i in 1:ncol(treat.endo)){
write.csv(topTreat(treat.endo,coef=i,n="Inf"),
file=paste("./output/DEAnalysis/BroadCellTypes/TREAT-indiv/de-endo-",colnames(treat.endo)[i],".csv",sep=""),
row.names = FALSE)
}
# Pericyte
for(i in 1:ncol(treat.peri)){
write.csv(topTreat(treat.peri,coef=i,n="Inf"),
file=paste("./output/DEAnalysis/BroadCellTypes/TREAT-indiv/de-pericyte-",colnames(treat.peri)[i],".csv",sep=""),
row.names = FALSE)
}
# Fibroblasts
for(i in 1:ncol(treat.fibro)){
write.csv(topTreat(treat.fibro,coef=i,n="Inf"),
file=paste("./output/DEAnalysis/BroadCellTypes/TREAT-indiv/de-fibro-",colnames(treat.fibro)[i],".csv",sep=""),
row.names = FALSE)
}
# Immune
for(i in 1:ncol(treat.immune)){
write.csv(topTreat(treat.immune,coef=i,n="Inf"),
file=paste("./output/DEAnalysis/BroadCellTypes/TREAT-indiv/de-immune-",colnames(treat.immune)[i],".csv",sep=""),
row.names = FALSE)
}
# Neurons
for(i in 1:ncol(treat.neurons)){
write.csv(topTreat(treat.neurons,coef=i,n="Inf"),
file=paste("./output/DEAnalysis/BroadCellTypes/TREAT-indiv/de-neurons-",colnames(treat.neurons)[i],".csv",sep=""),
row.names = FALSE)
}
# smooth muscle cells
for(i in 1:ncol(treat.smc)){
write.csv(topTreat(treat.smc,coef=i,n="Inf"),
file=paste("./output/DEAnalysis/BroadCellTypes/TREAT-indiv/de-smc-",colnames(treat.smc)[i],".csv",sep=""),
row.names = FALSE)
}
sessionInfo()R version 4.1.2 (2021-11-01)
Platform: x86_64-pc-linux-gnu (64-bit)
Running under: CentOS Linux 7 (Core)
Matrix products: default
BLAS: /hpc/software/installed/R/4.1.2/lib64/R/lib/libRblas.so
LAPACK: /hpc/software/installed/R/4.1.2/lib64/R/lib/libRlapack.so
locale:
[1] LC_CTYPE=en_US.UTF-8 LC_NUMERIC=C
[3] LC_TIME=en_US.UTF-8 LC_COLLATE=en_US.UTF-8
[5] LC_MONETARY=en_US.UTF-8 LC_MESSAGES=en_US.UTF-8
[7] LC_PAPER=en_US.UTF-8 LC_NAME=C
[9] LC_ADDRESS=C LC_TELEPHONE=C
[11] LC_MEASUREMENT=en_US.UTF-8 LC_IDENTIFICATION=C
attached base packages:
[1] stats4 stats graphics grDevices utils datasets methods
[8] base
other attached packages:
[1] dplyr_1.0.8 clustree_0.4.4
[3] ggraph_2.0.5 ggplot2_3.3.5
[5] NMF_0.23.0 bigmemory_4.5.36
[7] cluster_2.1.2 rngtools_1.5.2
[9] pkgmaker_0.32.2 registry_0.5-1
[11] scran_1.22.1 scuttle_1.4.0
[13] SingleCellExperiment_1.16.0 SummarizedExperiment_1.24.0
[15] GenomicRanges_1.46.1 GenomeInfoDb_1.30.1
[17] DelayedArray_0.20.0 MatrixGenerics_1.6.0
[19] matrixStats_0.61.0 Matrix_1.4-0
[21] cowplot_1.1.1 SeuratObject_4.0.4
[23] Seurat_4.1.0 org.Hs.eg.db_3.14.0
[25] AnnotationDbi_1.56.2 IRanges_2.28.0
[27] S4Vectors_0.32.3 Biobase_2.54.0
[29] BiocGenerics_0.40.0 RColorBrewer_1.1-2
[31] edgeR_3.36.0 limma_3.50.1
[33] workflowr_1.7.0
loaded via a namespace (and not attached):
[1] utf8_1.2.2 reticulate_1.24
[3] tidyselect_1.1.2 RSQLite_2.2.10
[5] htmlwidgets_1.5.4 grid_4.1.2
[7] BiocParallel_1.28.3 Rtsne_0.15
[9] munsell_0.5.0 ScaledMatrix_1.2.0
[11] codetools_0.2-18 ica_1.0-2
[13] statmod_1.4.36 future_1.24.0
[15] miniUI_0.1.1.1 withr_2.4.3
[17] spatstat.random_2.1-0 colorspace_2.0-3
[19] highr_0.9 knitr_1.37
[21] rstudioapi_0.13 ROCR_1.0-11
[23] tensor_1.5 listenv_0.8.0
[25] git2r_0.29.0 GenomeInfoDbData_1.2.7
[27] polyclip_1.10-0 farver_2.1.0
[29] bit64_4.0.5 rprojroot_2.0.2
[31] parallelly_1.30.0 vctrs_0.3.8
[33] generics_0.1.2 xfun_0.29
[35] doParallel_1.0.17 R6_2.5.1
[37] graphlayouts_0.8.0 rsvd_1.0.5
[39] locfit_1.5-9.4 bitops_1.0-7
[41] spatstat.utils_2.3-0 cachem_1.0.6
[43] assertthat_0.2.1 promises_1.2.0.1
[45] scales_1.1.1 gtable_0.3.0
[47] beachmat_2.10.0 globals_0.14.0
[49] processx_3.5.2 goftest_1.2-3
[51] tidygraph_1.2.0 rlang_1.0.1
[53] splines_4.1.2 lazyeval_0.2.2
[55] spatstat.geom_2.3-2 yaml_2.3.5
[57] reshape2_1.4.4 abind_1.4-5
[59] httpuv_1.6.5 tools_4.1.2
[61] gridBase_0.4-7 ellipsis_0.3.2
[63] spatstat.core_2.4-0 jquerylib_0.1.4
[65] ggridges_0.5.3 Rcpp_1.0.8
[67] plyr_1.8.6 sparseMatrixStats_1.6.0
[69] zlibbioc_1.40.0 purrr_0.3.4
[71] RCurl_1.98-1.6 ps_1.6.0
[73] rpart_4.1.16 deldir_1.0-6
[75] viridis_0.6.2 pbapply_1.5-0
[77] zoo_1.8-9 ggrepel_0.9.1
[79] fs_1.5.2 magrittr_2.0.2
[81] data.table_1.14.2 scattermore_0.8
[83] lmtest_0.9-39 RANN_2.6.1
[85] whisker_0.4 fitdistrplus_1.1-6
[87] patchwork_1.1.1 mime_0.12
[89] evaluate_0.15 xtable_1.8-4
[91] gridExtra_2.3 compiler_4.1.2
[93] tibble_3.1.6 KernSmooth_2.23-20
[95] crayon_1.5.0 htmltools_0.5.2
[97] mgcv_1.8-39 later_1.3.0
[99] tidyr_1.2.0 DBI_1.1.2
[101] tweenr_1.0.2 MASS_7.3-55
[103] cli_3.2.0 parallel_4.1.2
[105] metapod_1.2.0 igraph_1.2.11
[107] bigmemory.sri_0.1.3 pkgconfig_2.0.3
[109] getPass_0.2-2 plotly_4.10.0
[111] spatstat.sparse_2.1-0 foreach_1.5.2
[113] bslib_0.3.1 dqrng_0.3.0
[115] XVector_0.34.0 stringr_1.4.0
[117] callr_3.7.0 digest_0.6.29
[119] sctransform_0.3.3 RcppAnnoy_0.0.19
[121] spatstat.data_2.1-2 Biostrings_2.62.0
[123] rmarkdown_2.12.1 leiden_0.3.9
[125] uwot_0.1.11 DelayedMatrixStats_1.16.0
[127] shiny_1.7.1 lifecycle_1.0.1
[129] nlme_3.1-155 jsonlite_1.8.0
[131] BiocNeighbors_1.12.0 viridisLite_0.4.0
[133] fansi_1.0.2 pillar_1.7.0
[135] lattice_0.20-45 KEGGREST_1.34.0
[137] fastmap_1.1.0 httr_1.4.2
[139] survival_3.3-0 glue_1.6.2
[141] iterators_1.0.14 png_0.1-7
[143] bluster_1.4.0 bit_4.0.4
[145] ggforce_0.3.3 stringi_1.7.6
[147] sass_0.4.0 blob_1.2.2
[149] BiocSingular_1.10.0 memoise_2.0.1
[151] irlba_2.3.5 future.apply_1.8.1